Watching from the sidelines for weeks as precious metals scored record highs on a regular basis, bitcoin on Tuesday was gaining as gold and silver posted their steepest declines in years.
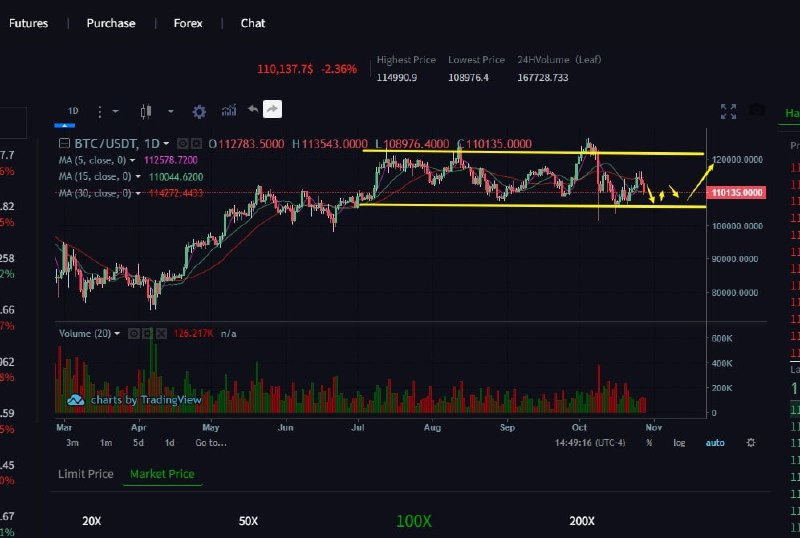
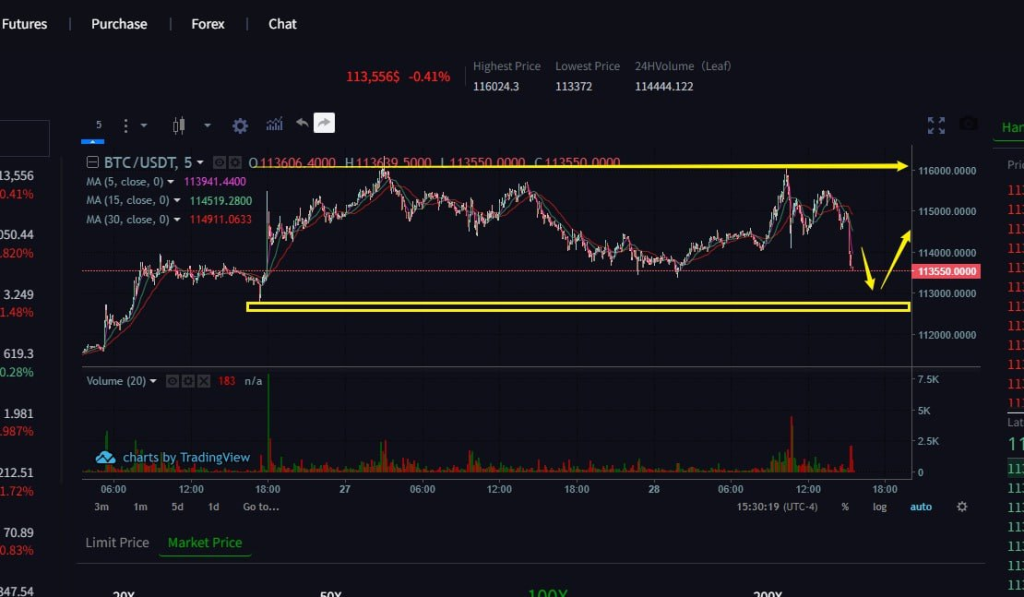
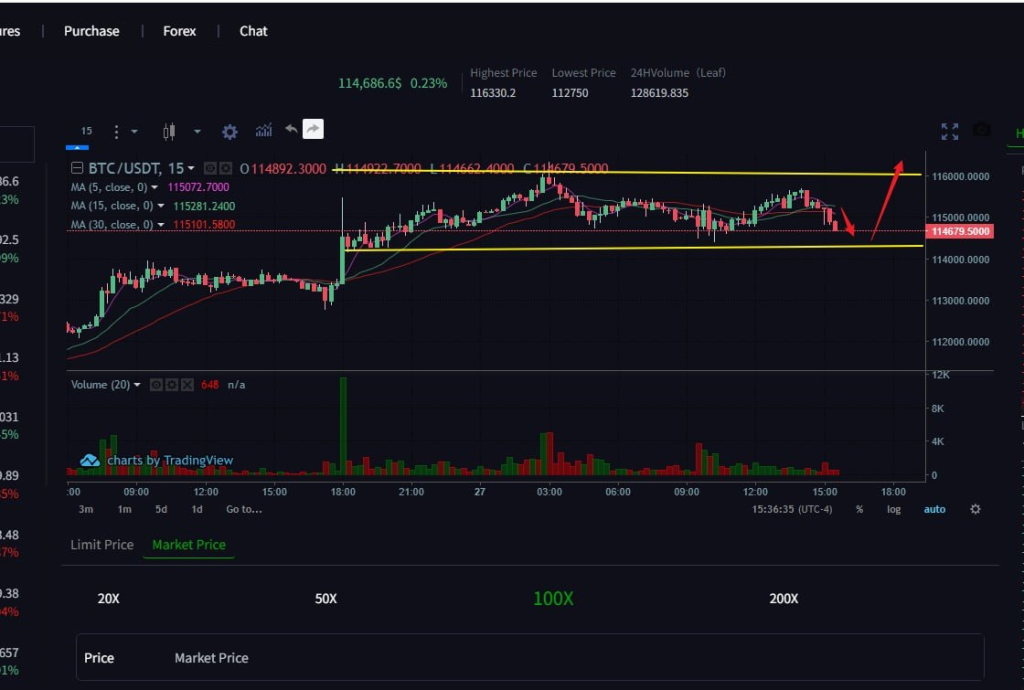
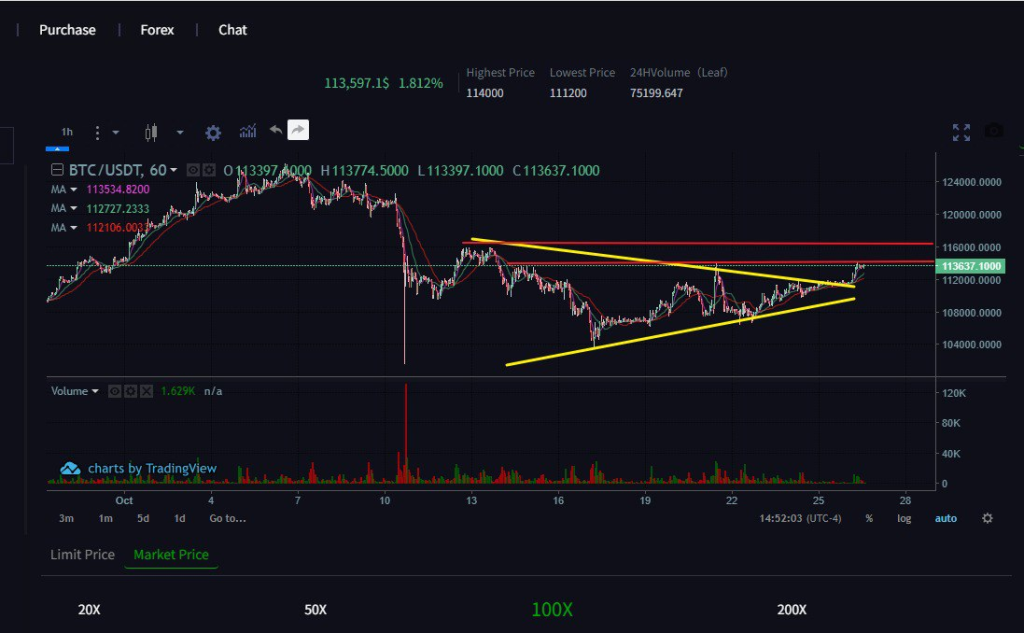
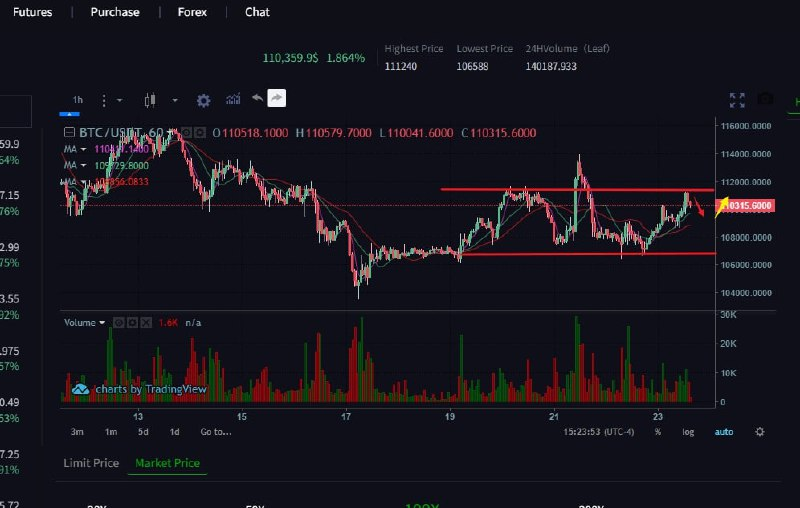
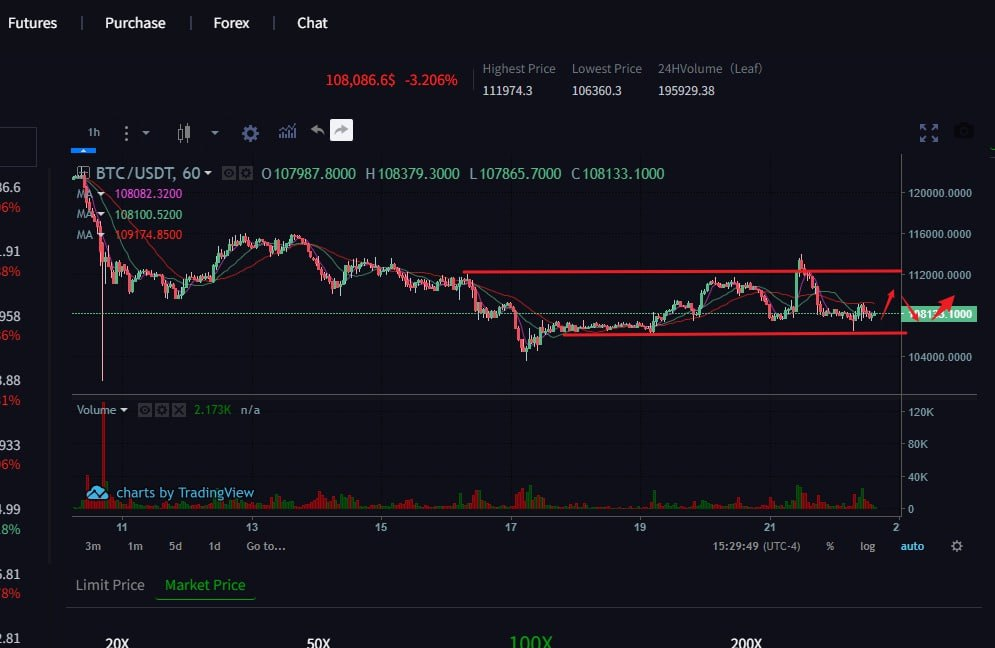
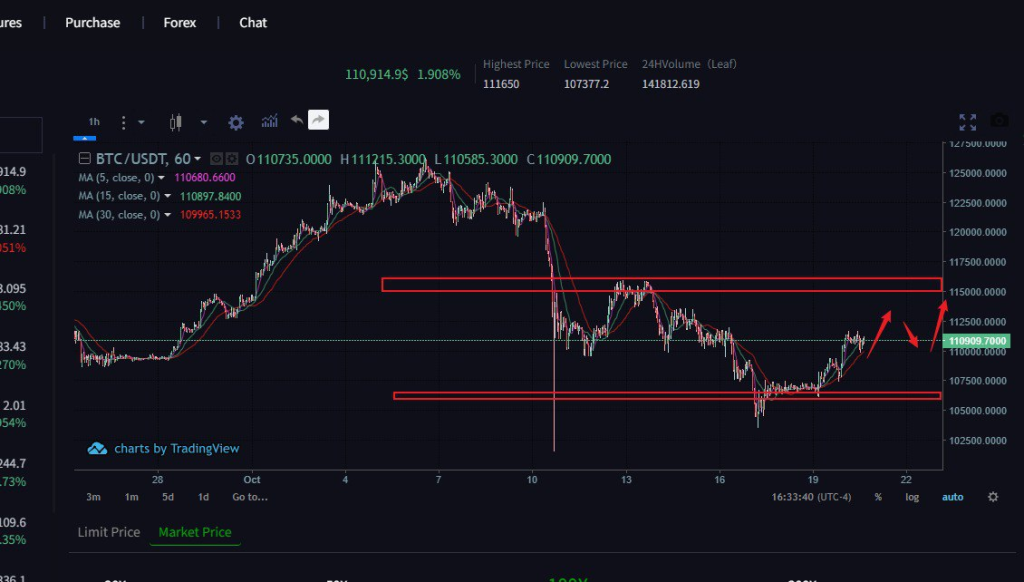
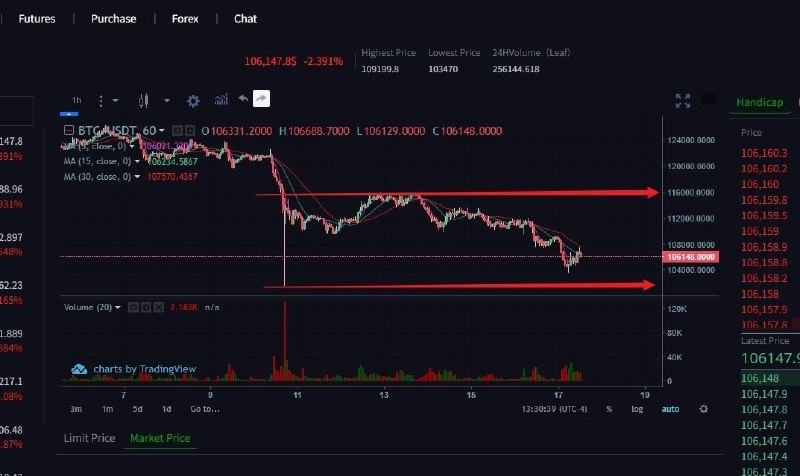
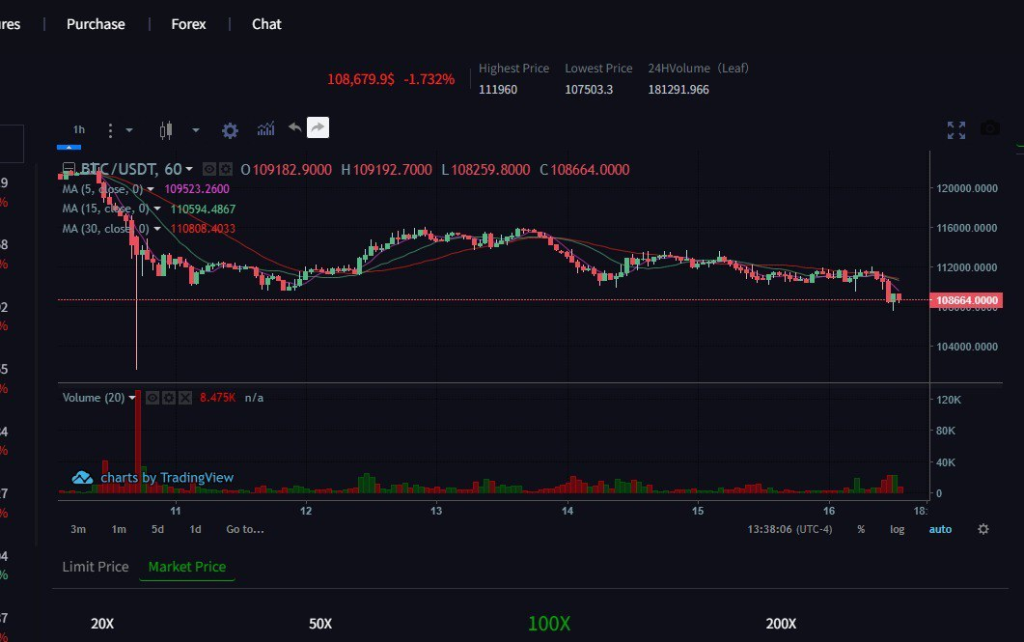
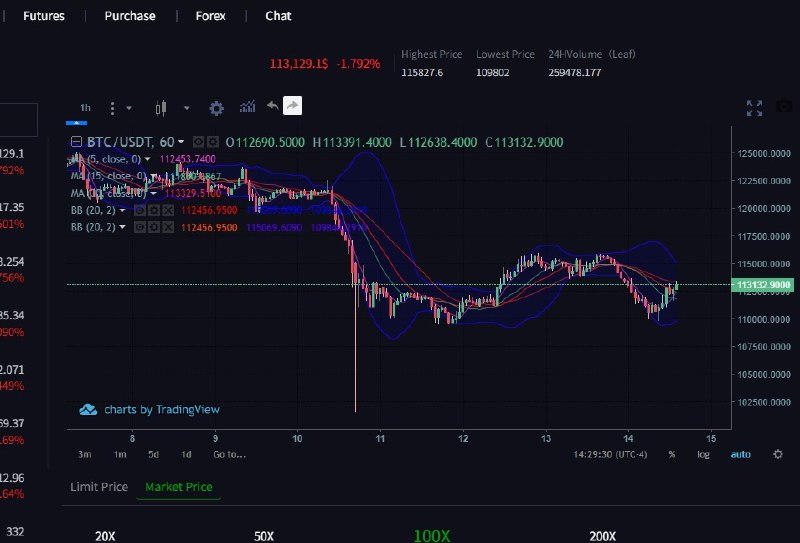
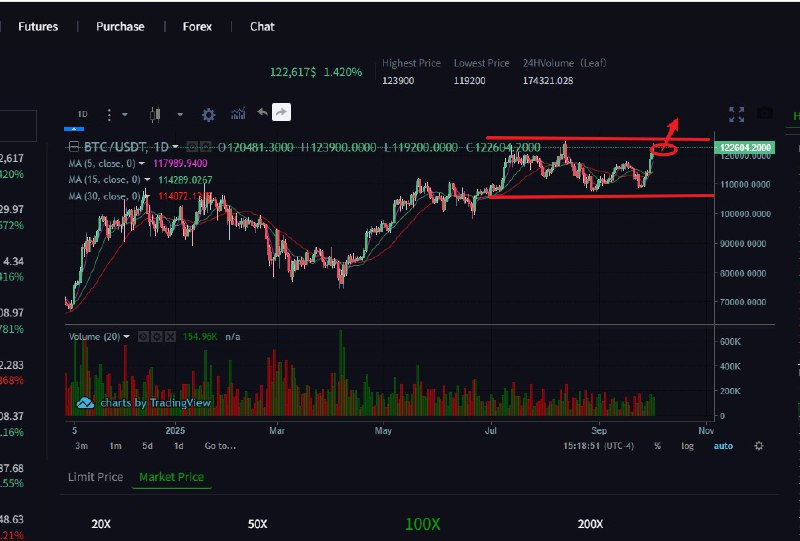
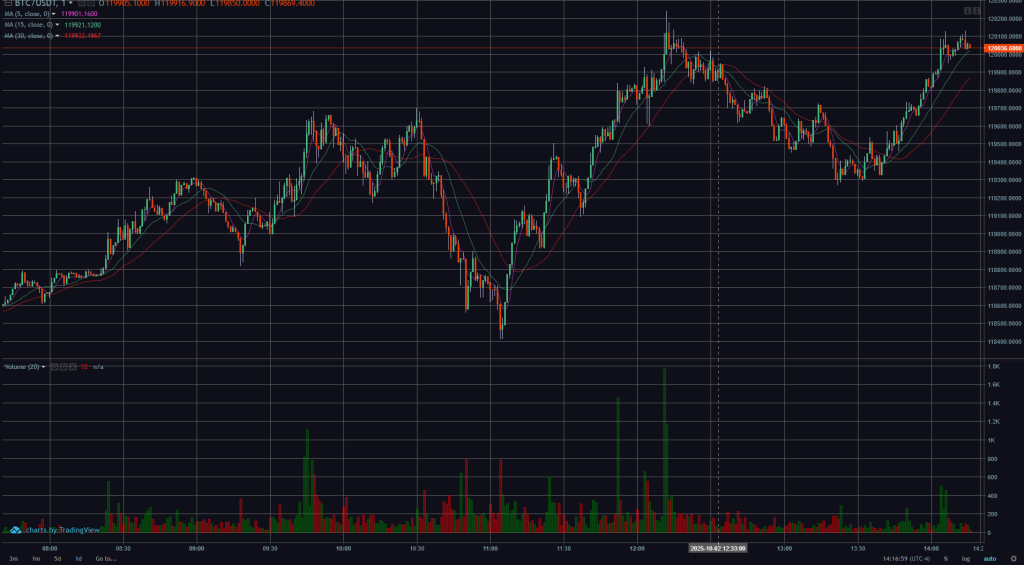
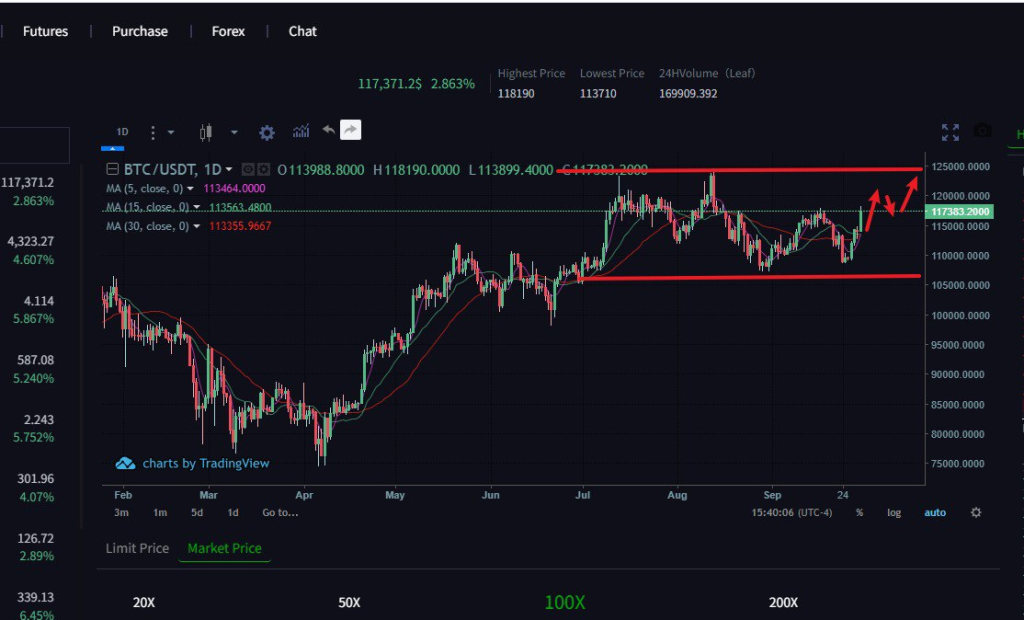
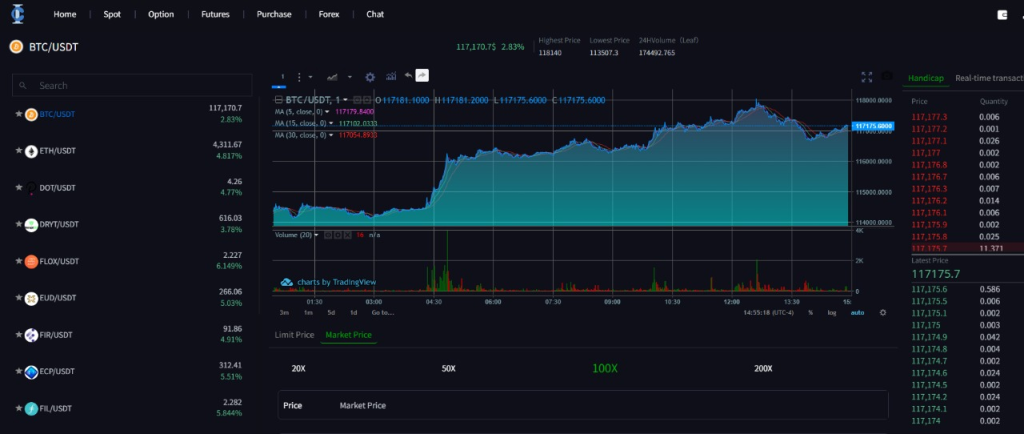
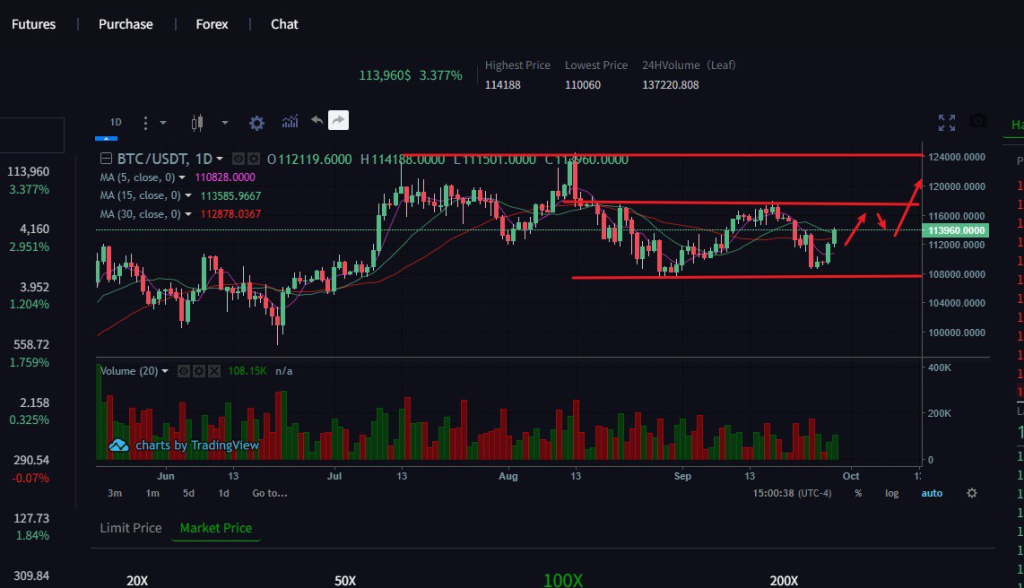
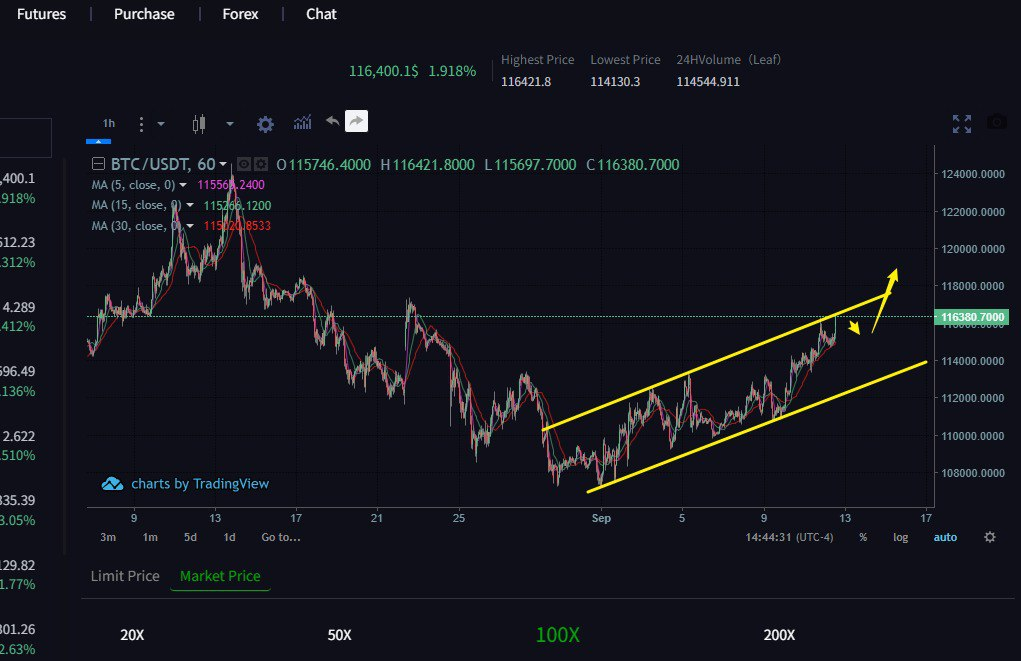
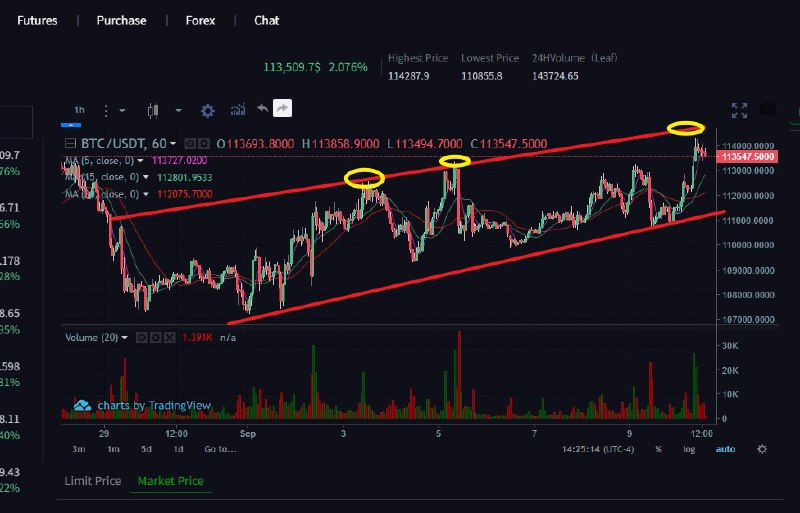
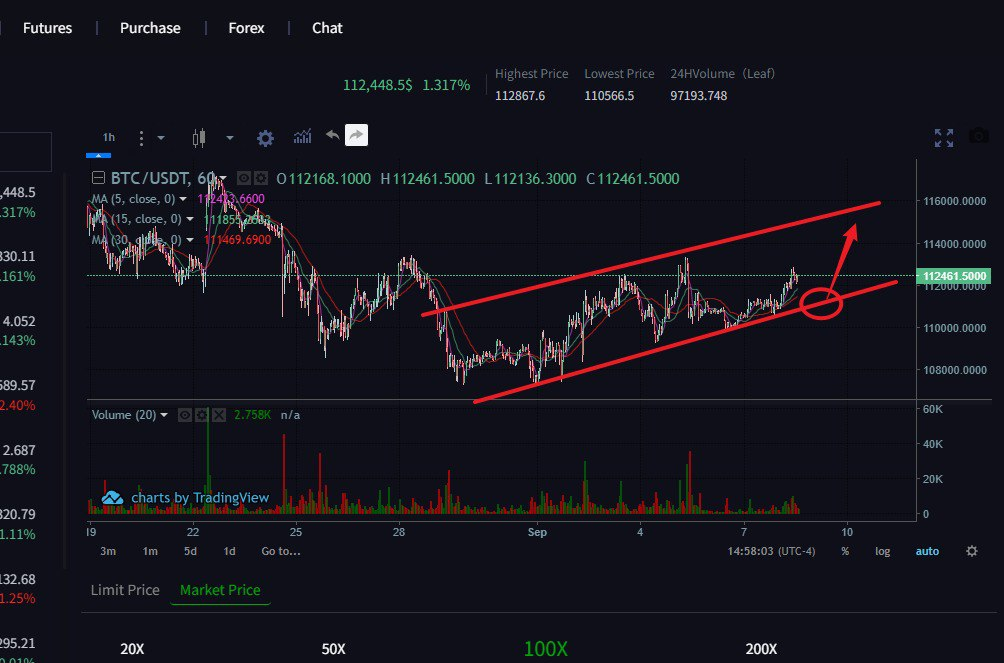
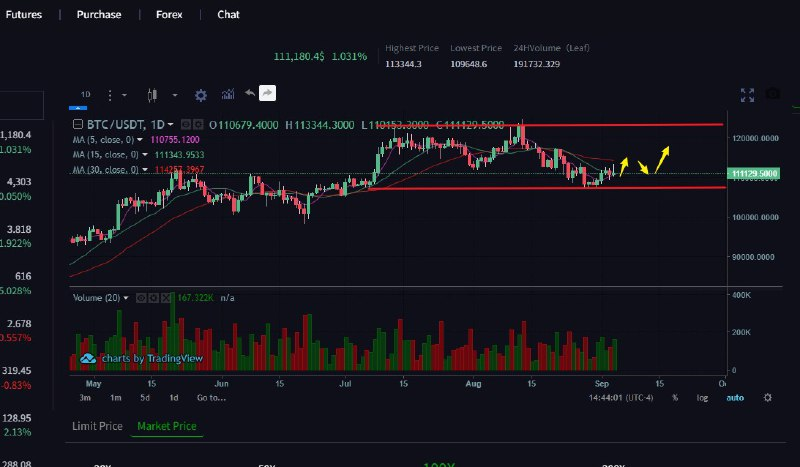
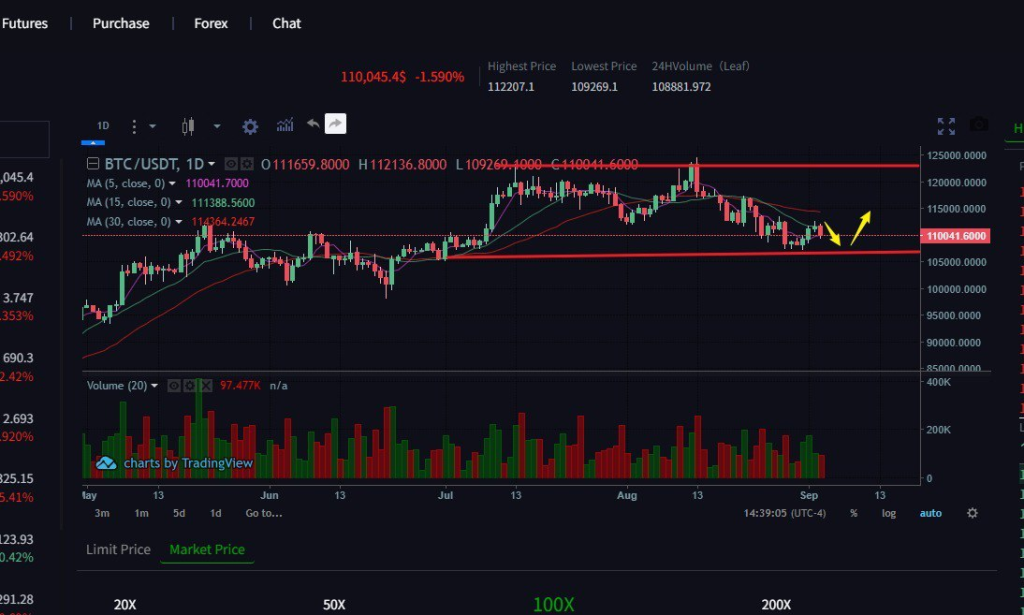
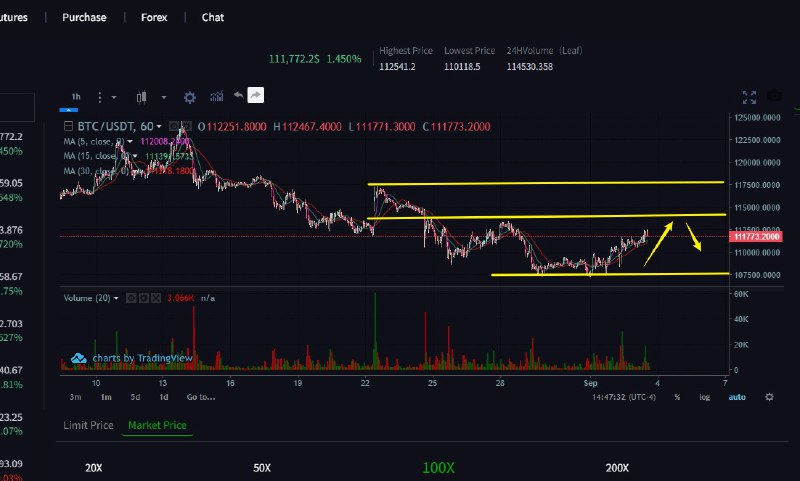
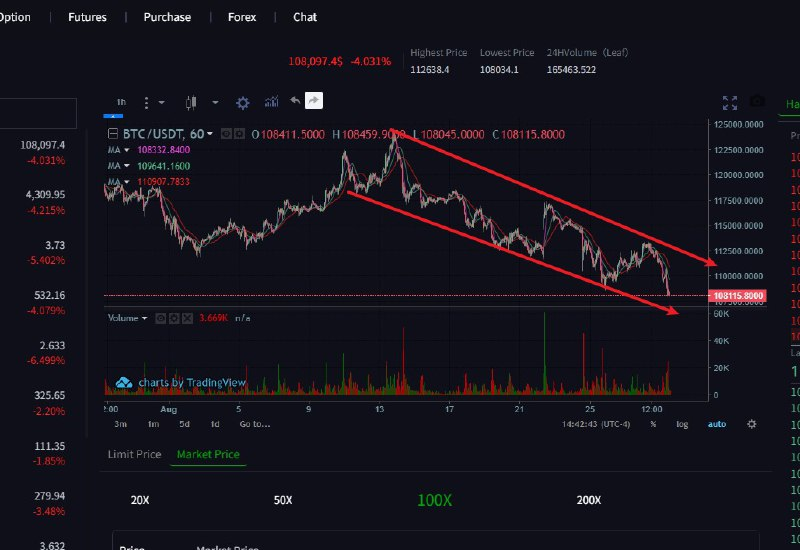
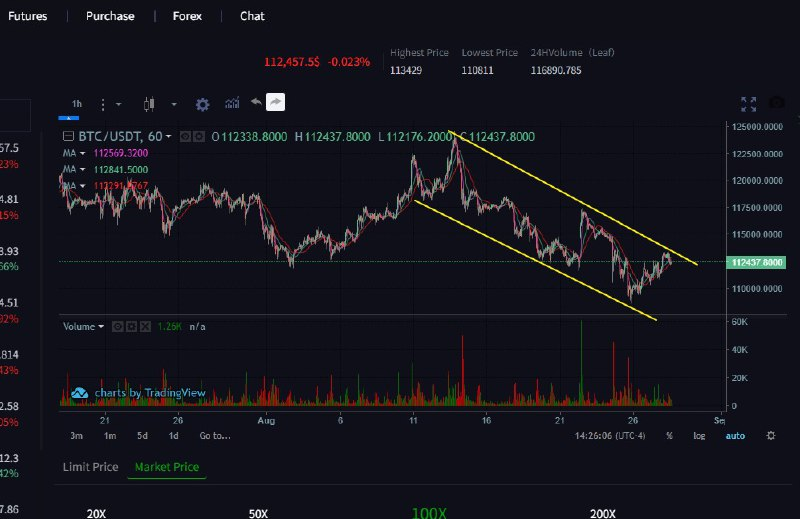
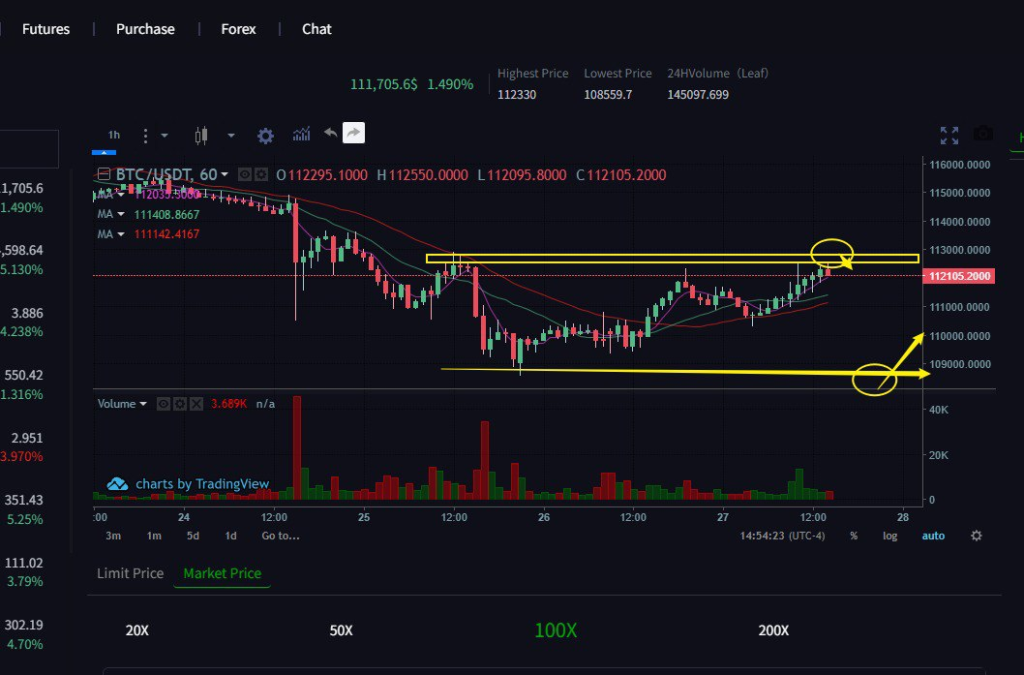
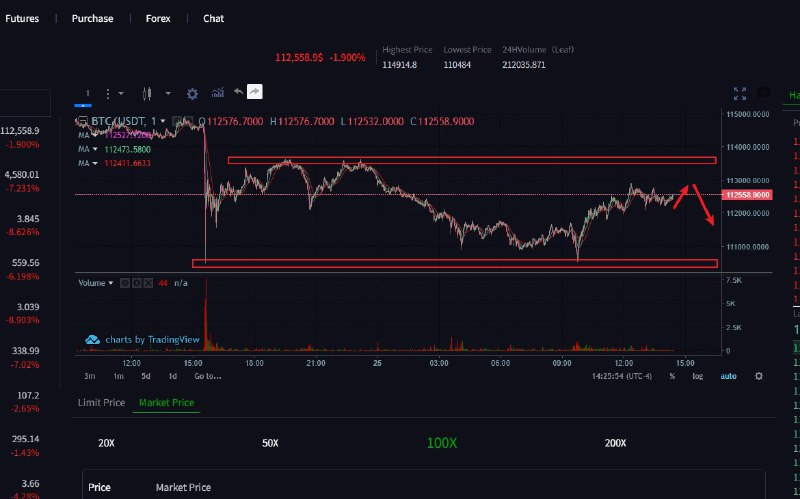
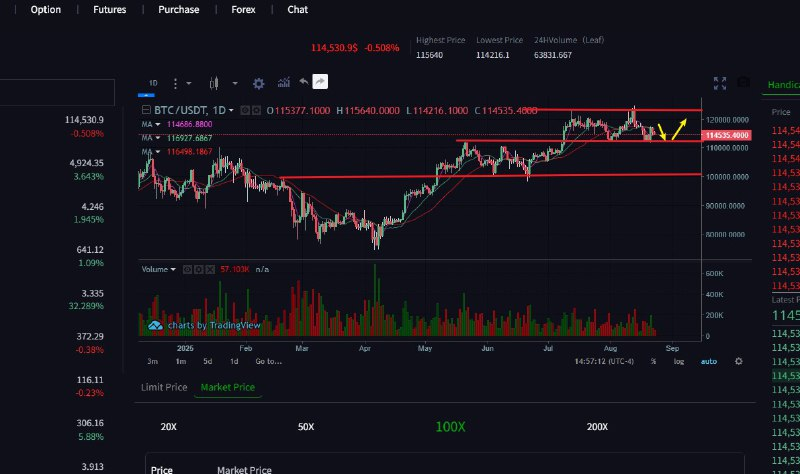
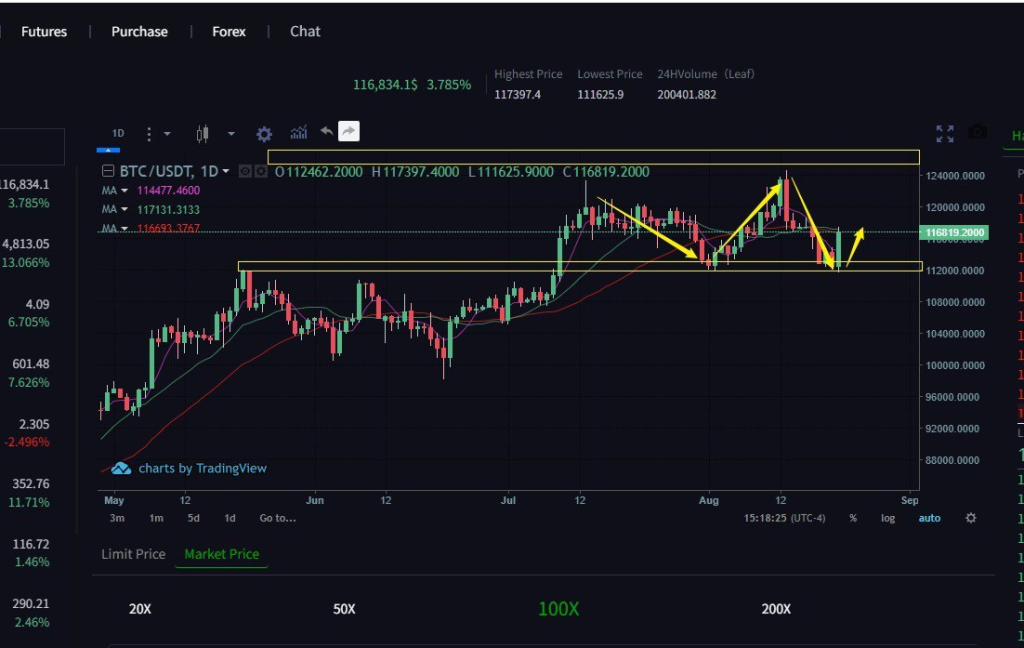
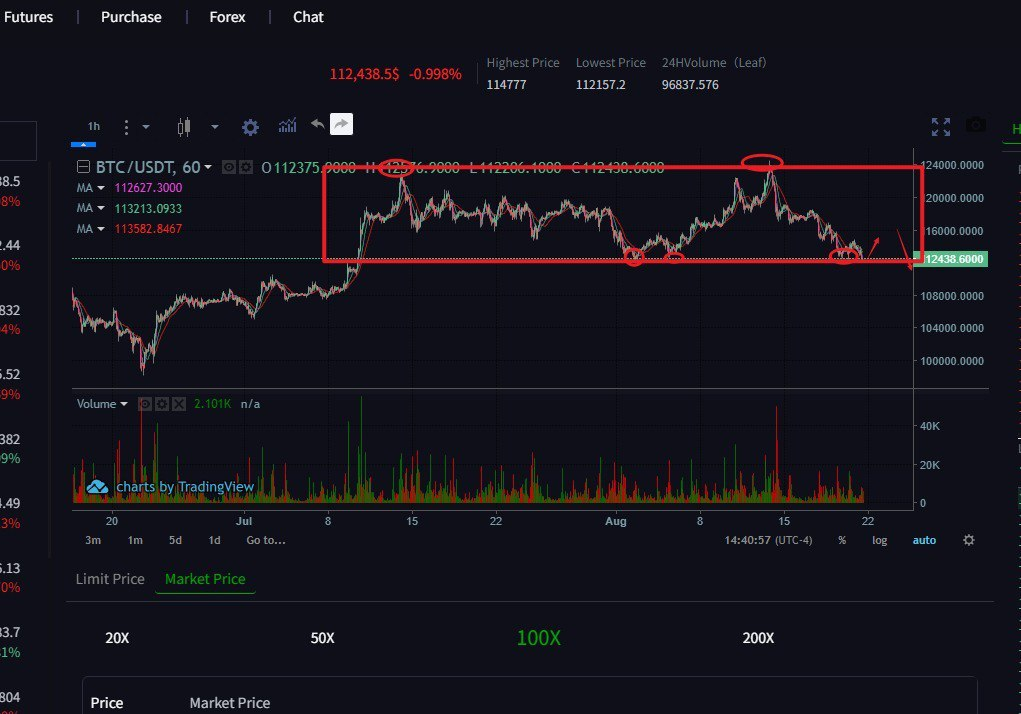
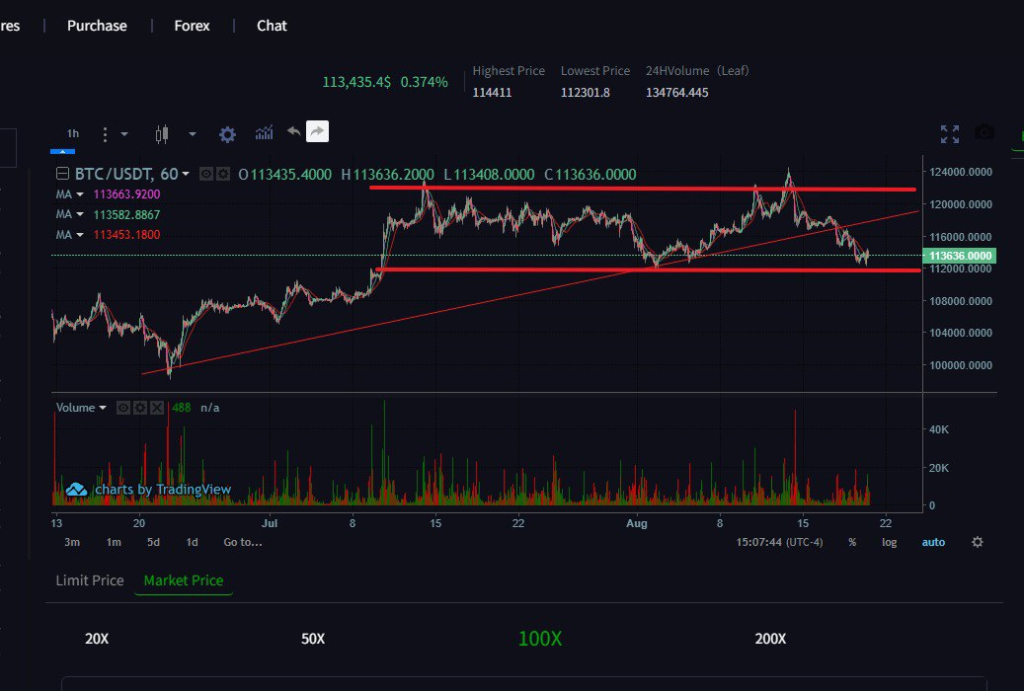
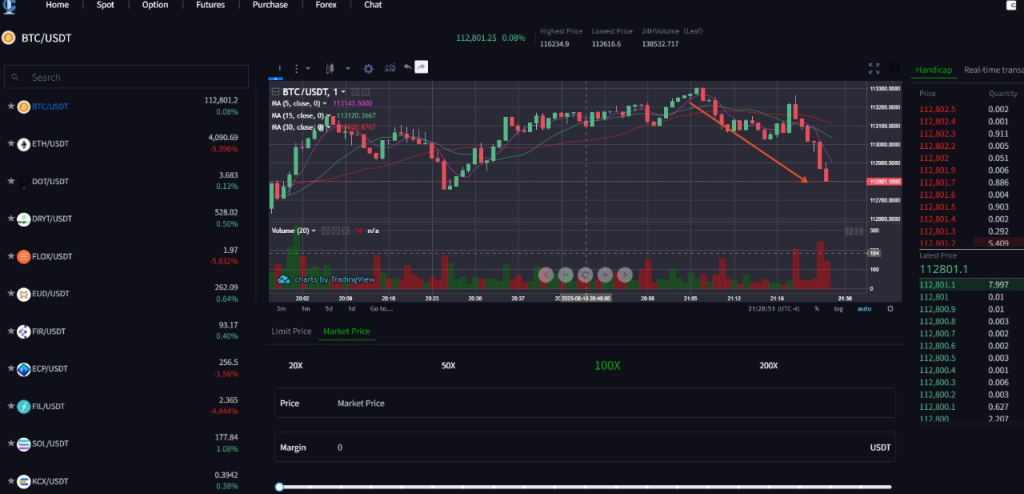
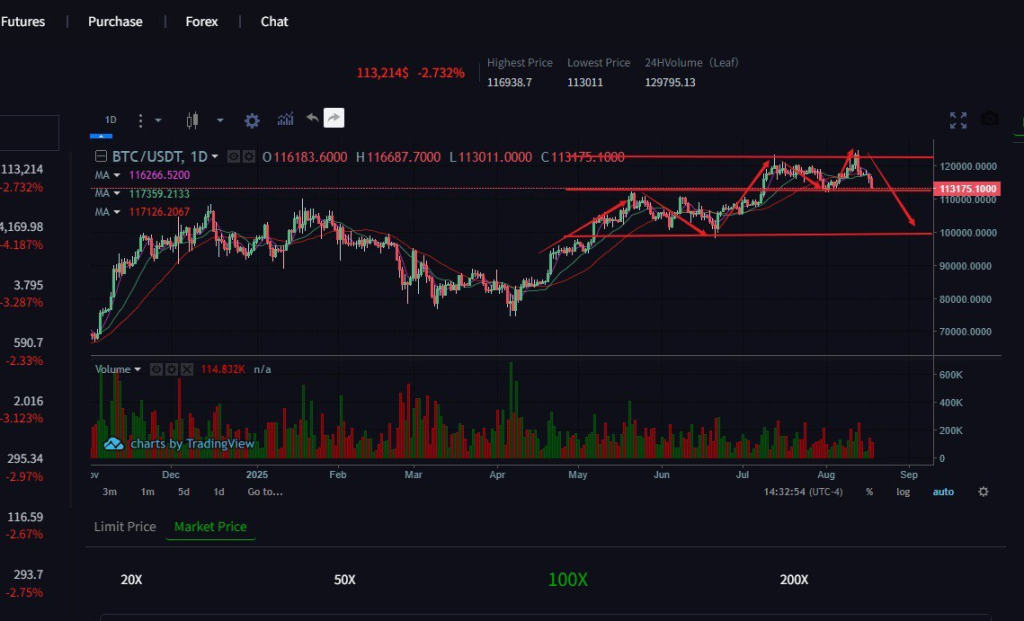
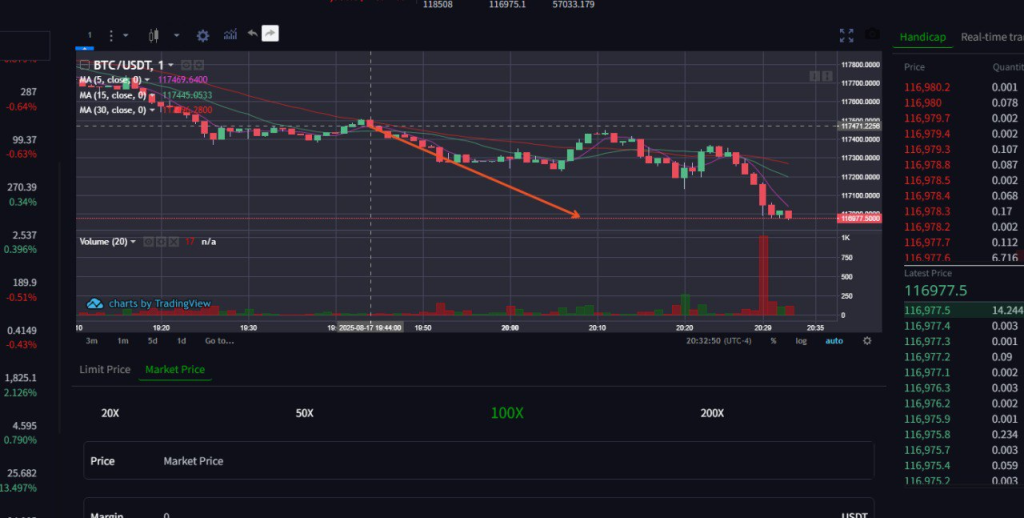
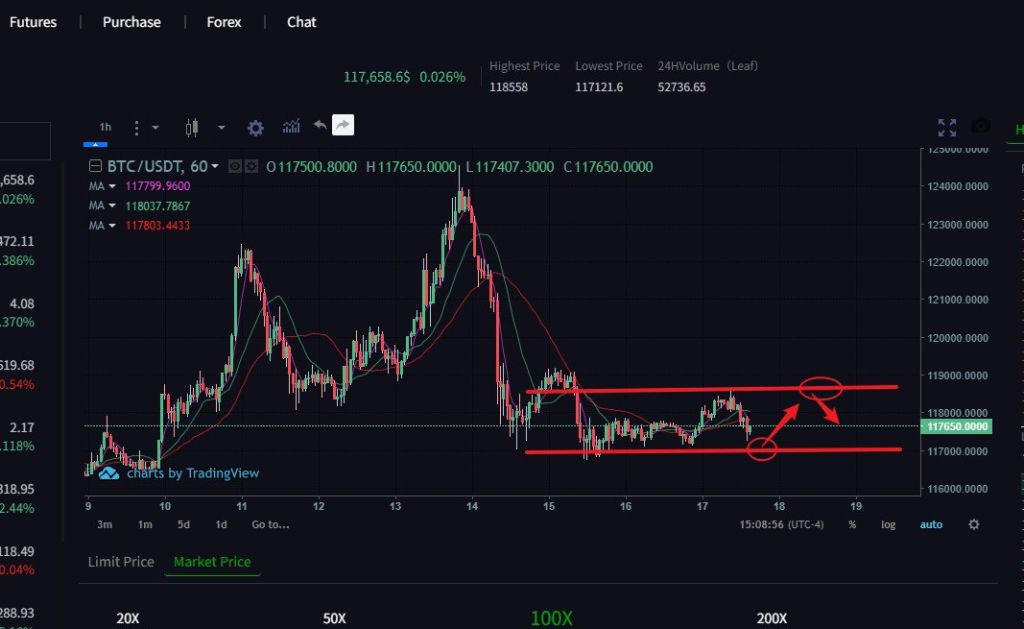
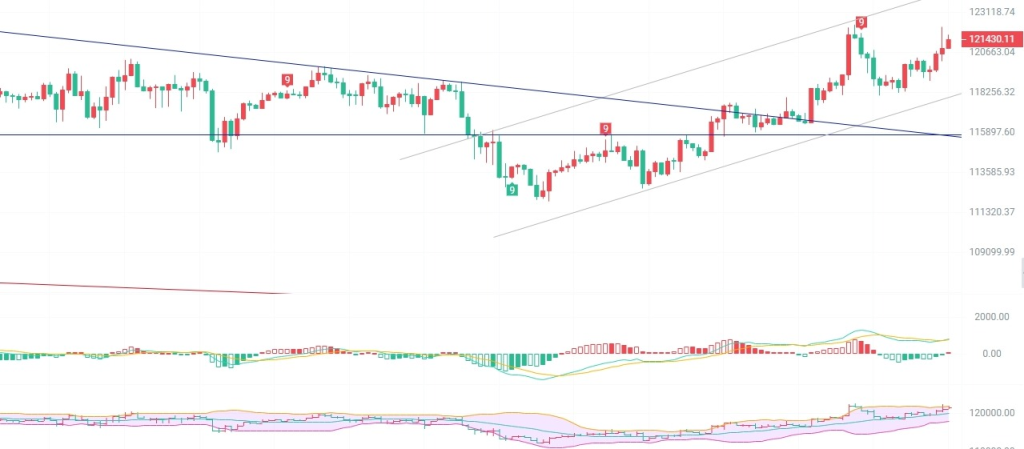
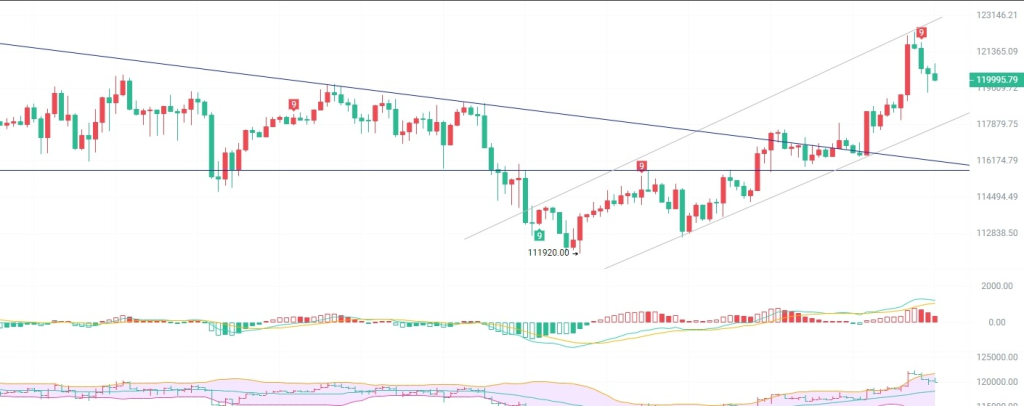
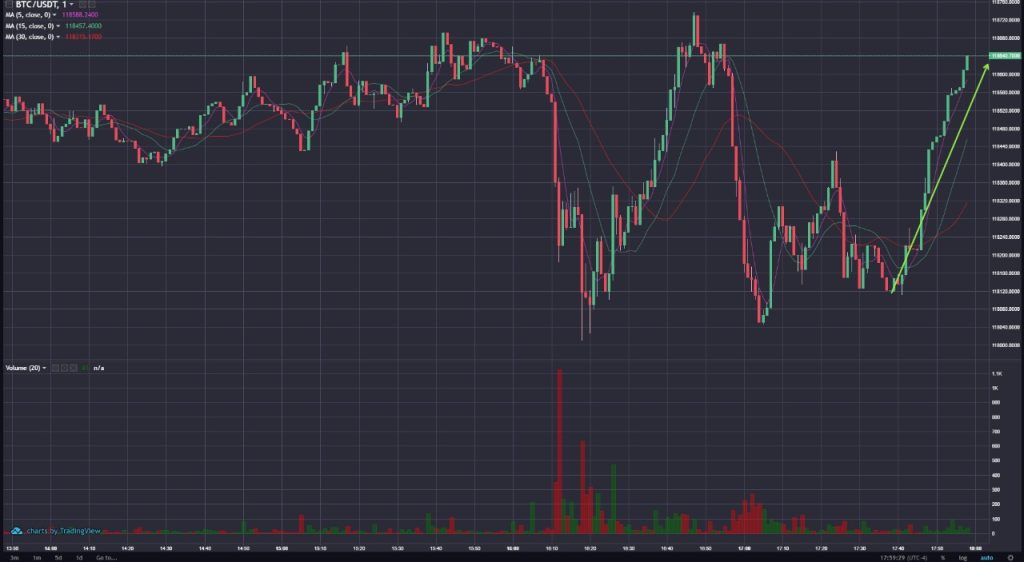
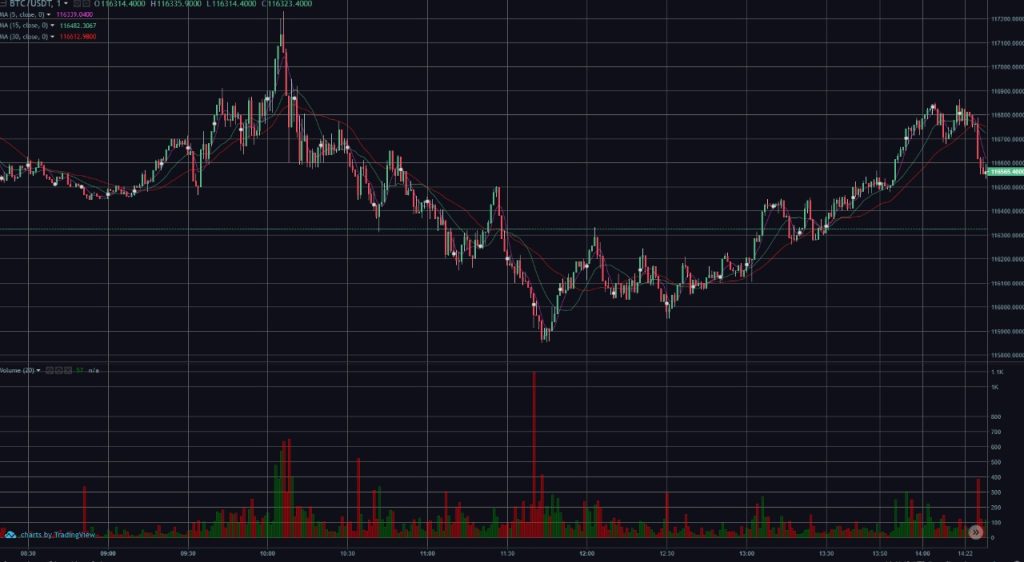
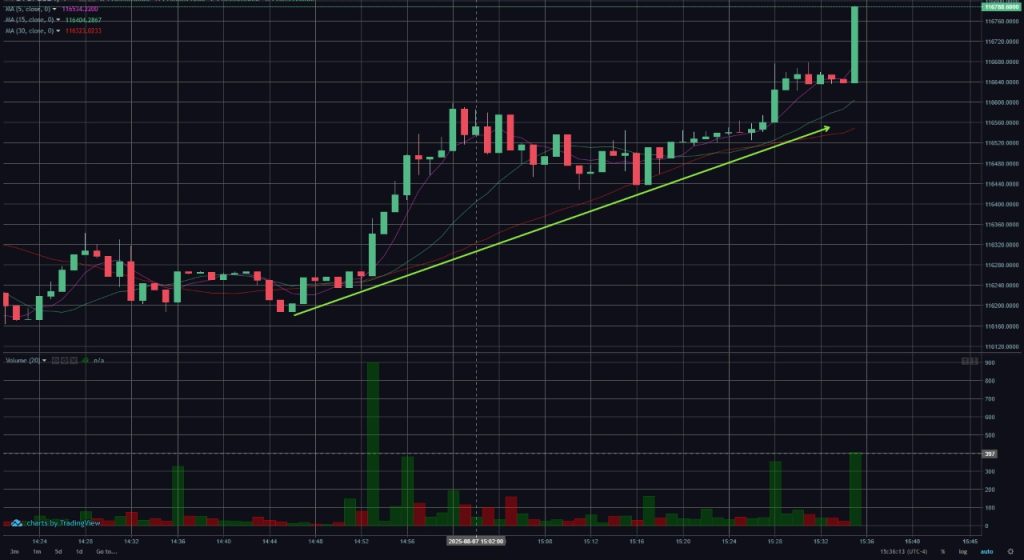
- Falling below $108,000 just hours ago, bitcoin surged just shy of $113,000 as precious metals experienced a steep selloff Tuesday.
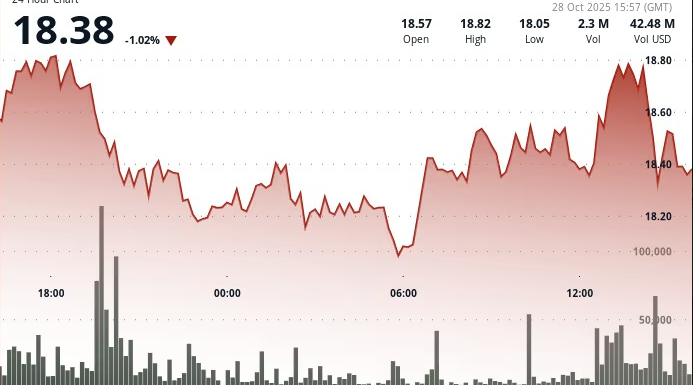
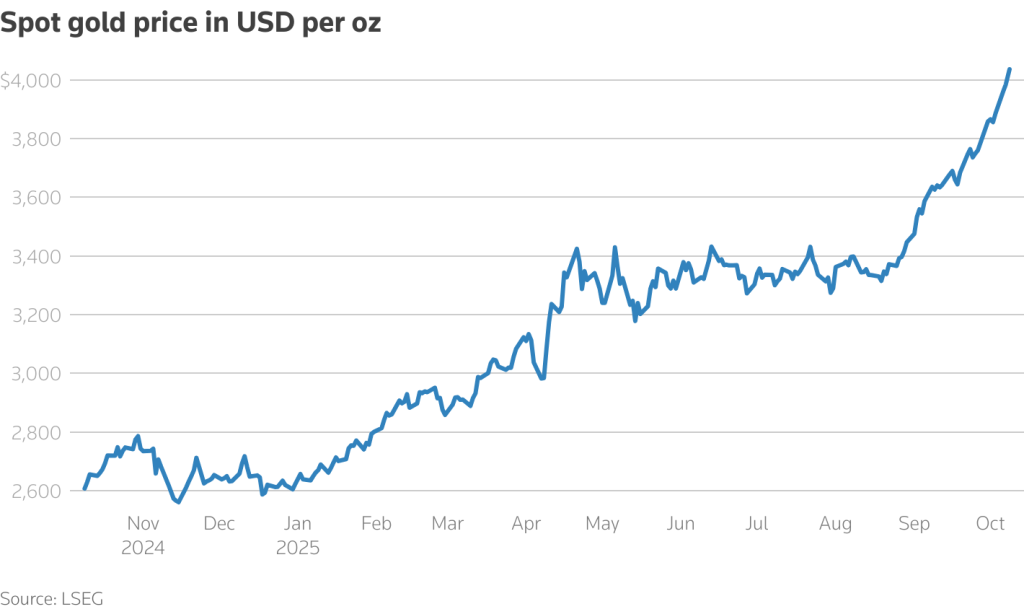
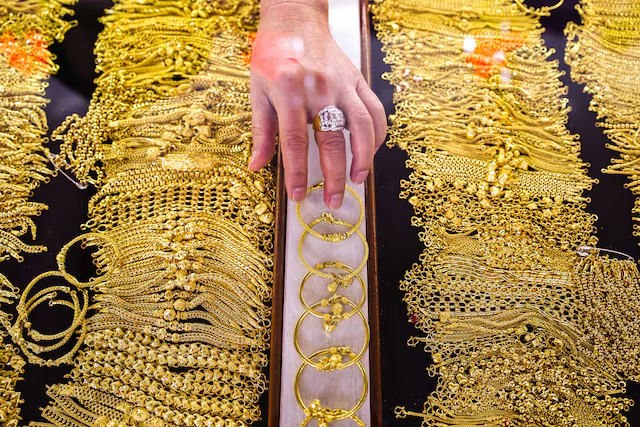
- Gold plunged 5%, its largest daily drop in years, while silver fell nearly 8%.
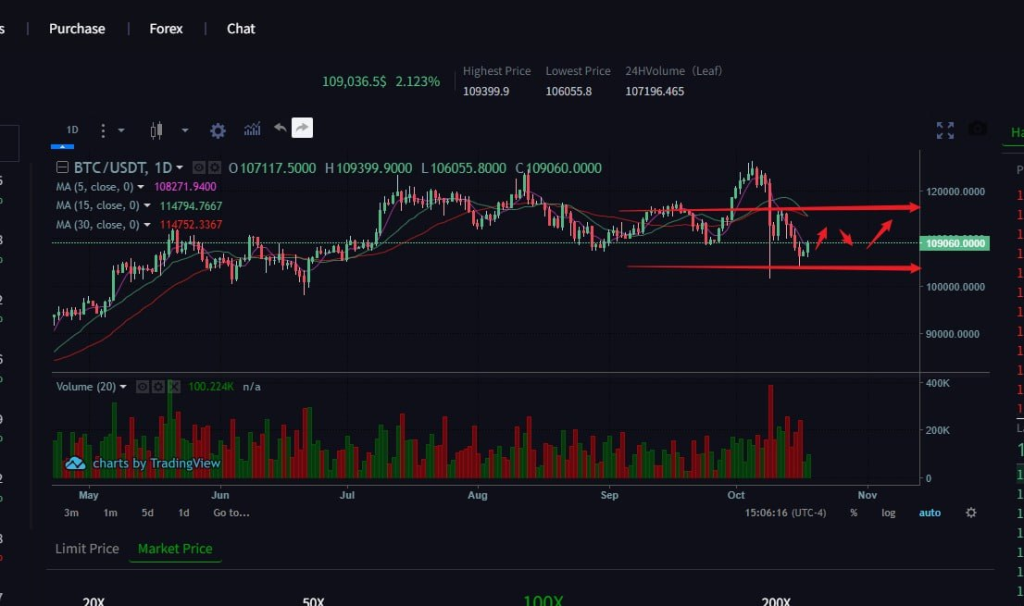
Bitcoin is catching a bid on Tuesday as the record rally in precious metals reverses in a big way.
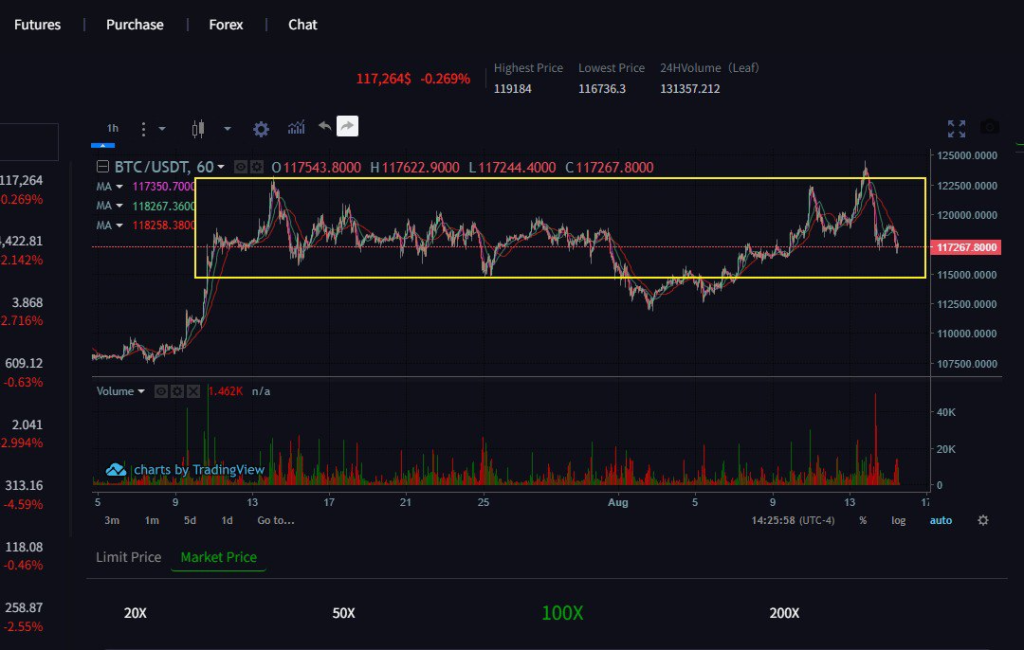
Gold saw a 5% decline to $4,130, its biggest daily drawdown in years. Silver also tumbled nearly 8%. The metals had surged over the past few months fueled by central banks moving into monetary easing mode, trade tensions between the U.S. and China, and signs of liquidity and credit stress in the financial system. Frustratingly to bitcoin bulls, though, those catalysts had provided little boost to the world’s largest crypto, which — with a couple of brief exceptions — has remained stuck in a tight range for months.
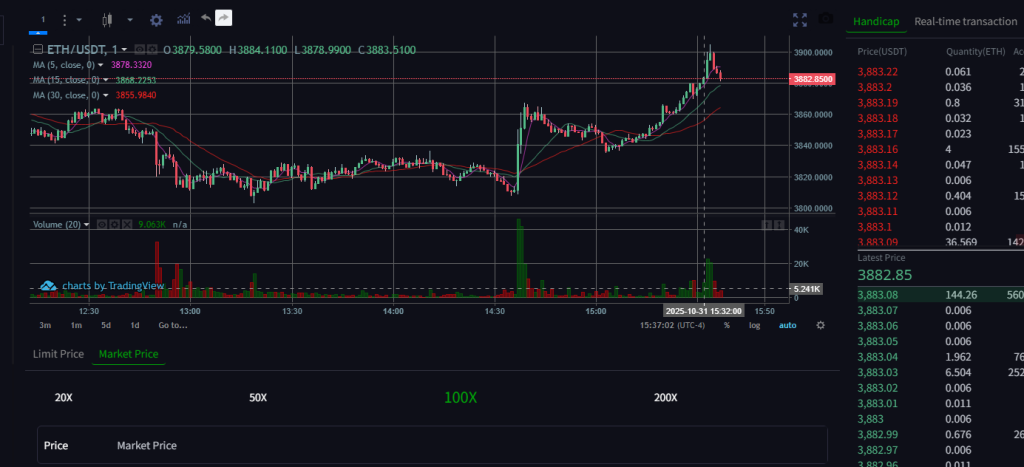
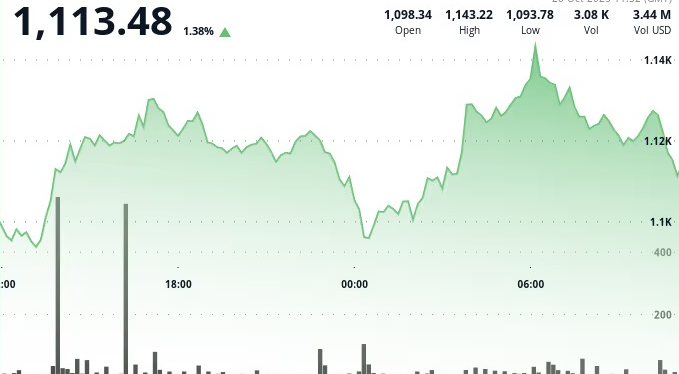
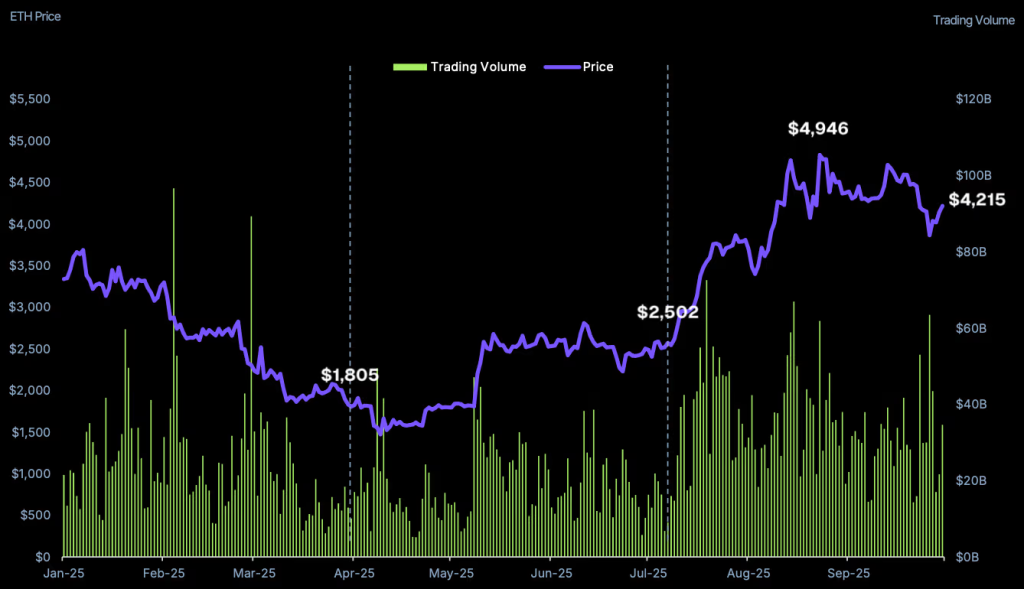
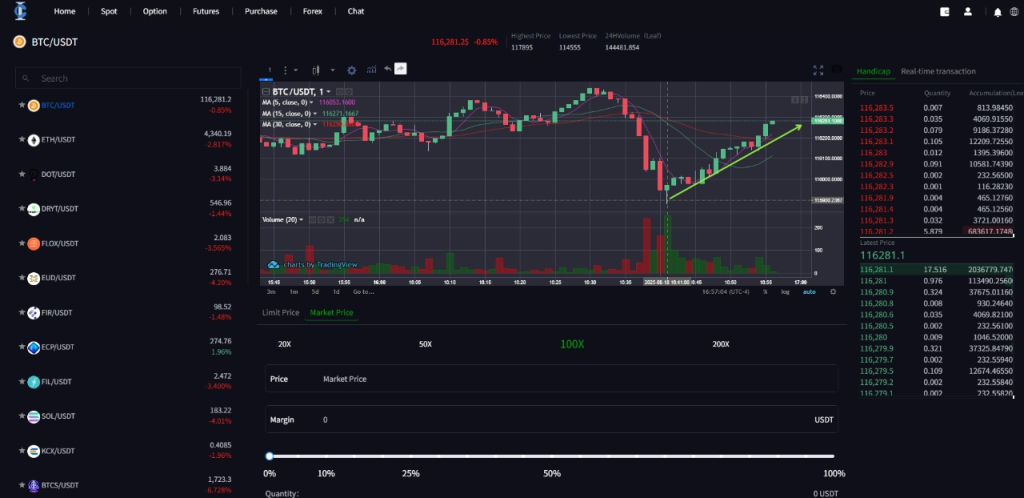
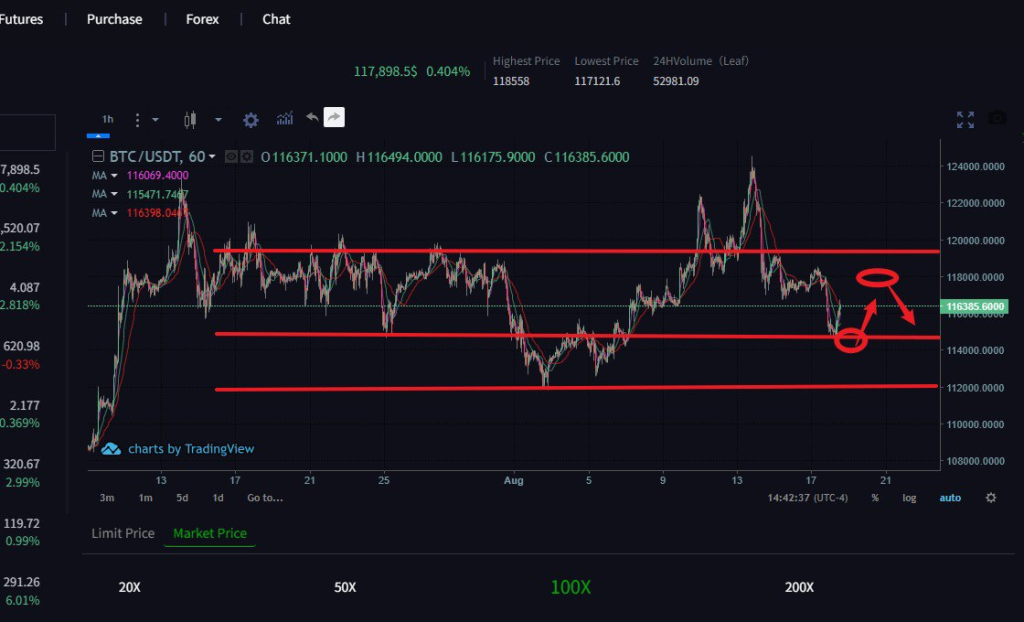
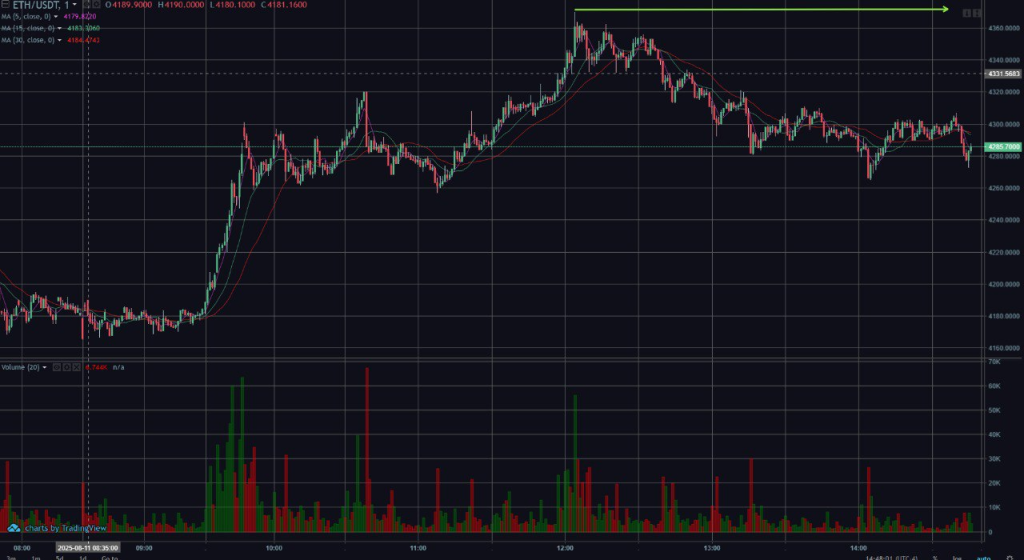
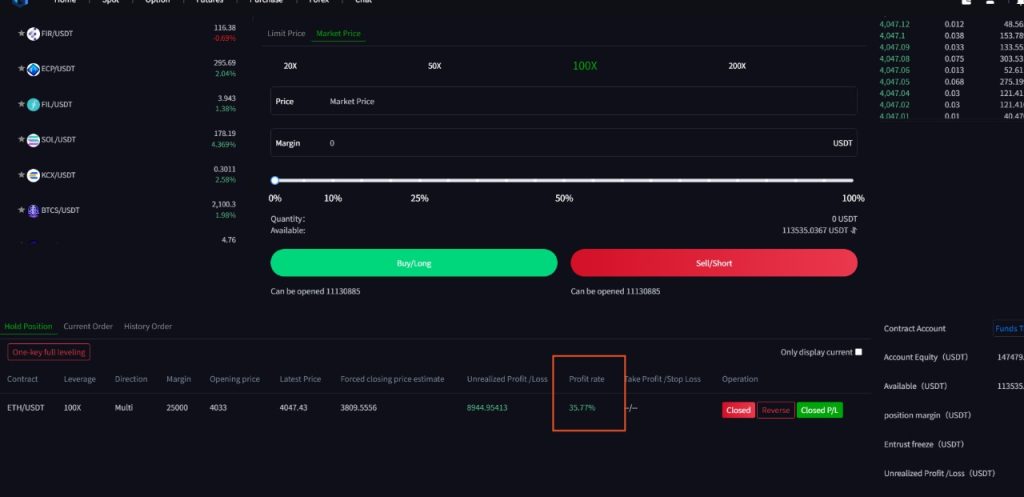
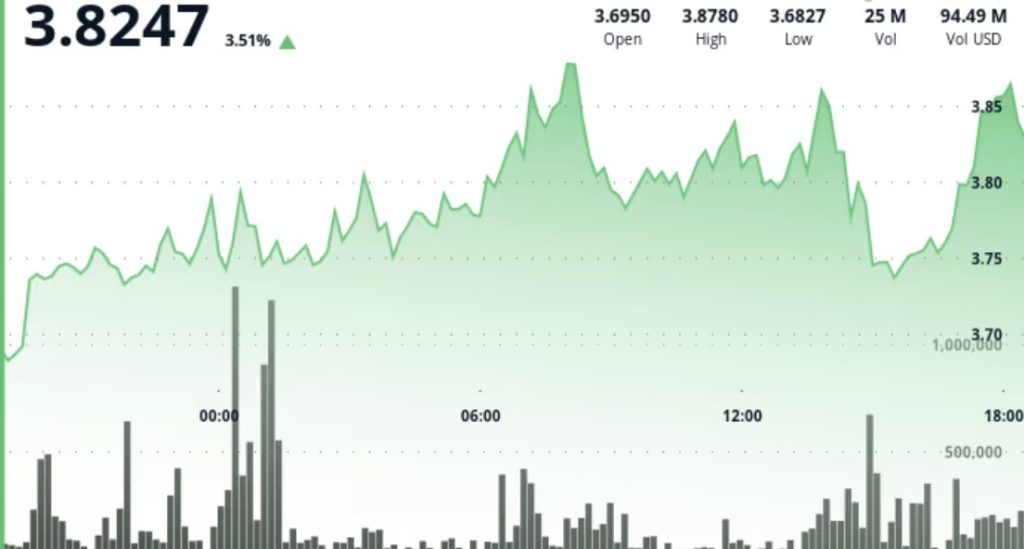
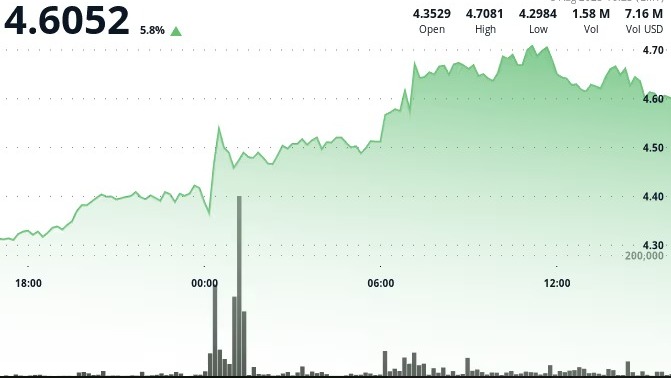
With the metals for at least this moment having fallen out of favor, however, money is flowing into bitcoin, which has rebounded to $112,700 after having dropped below $108,000 just hours ago. Ether also erased its overnight decline, bouncing back above $4,000.
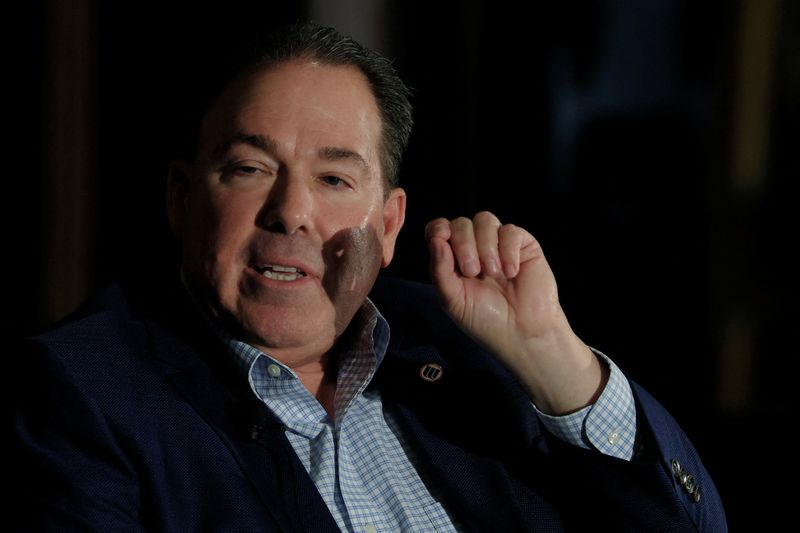
Quinn Thomson, founder of hedge fund Lekker Capital, said last week that BTC is poised to catch up to gold’s rally. Charlie Morris, CIO of ByteTree, also argued that bitcoin’s time to rally will come when gold rolls over to consolidate.
Crypto-related stocks haven’t really gotten the news, with most in the red on Tuesday, particularly the bitcoin miners, many of which are now trading more as AI infrastructure plays.
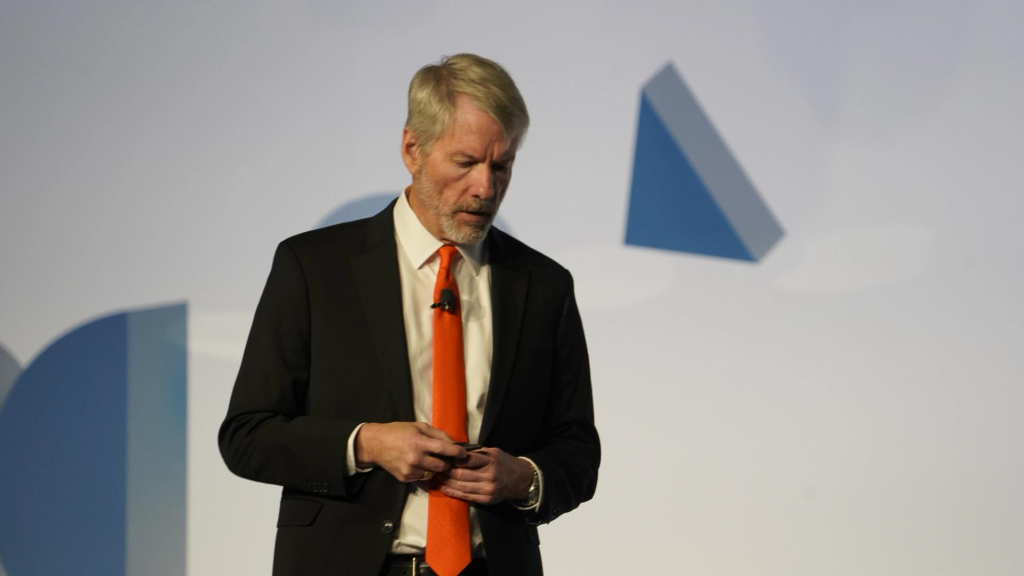
IREN (IREN), Hut 8 (HUT) and Bitfarms (BITF) are lower by 3%-4%. Stablecoin issuer Circle (CRCL) is down 1.2% and Coinbase (COIN) is lower by 0.5%. Michael Saylor’s Strategy (MSTR) is managing a 1.7% gain.