
Bitcoin trend analysis
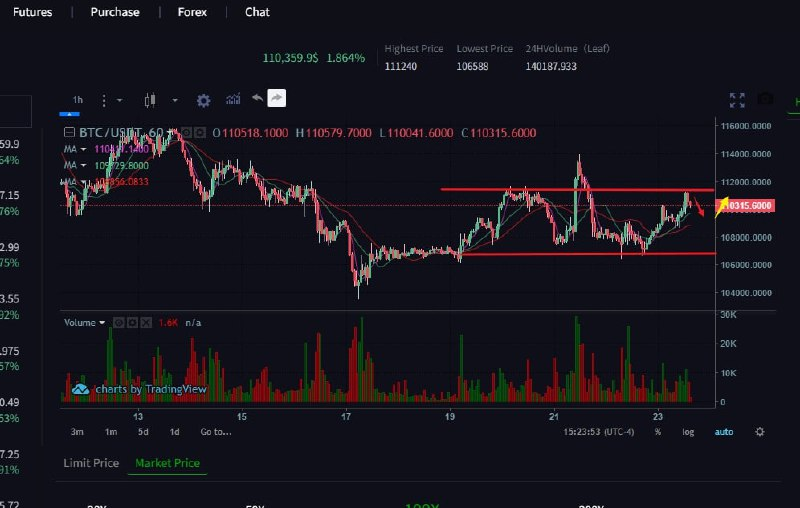
Bitcoin is currently trading at 110,300. BTC is trading between key support and resistance levels, with short-term momentum strengthening, but the trend direction remains unclear. The short-term moving averages have formed a golden cross, approaching the upper Bollinger Band, indicating a bullish bias. The emergence of an engulfing candlestick pattern could signal a short-term bullish reversal. A large bullish candlestick on the daily chart breaks through the previous day’s high of 110,576, signaling short-term bullish strength. The 2-hour candlestick chart shows a continuous upward trend, with gradually rising lows and continuously breaking highs, indicating a rebound. The 2-hour MACD is showing increasing momentum, with the daily chart correcting upward. The 2-hour EMA has formed a golden cross after the price effectively broke through the short-term moving averages. There is pressure on the daily chart, but this is only a short-term breakout.
Short-term trading strategy reference:
Long position at 109,000
Short position at 111,000