
Bitcoin Trend Analysis Today
Weekly Chart: The weekly trend is relatively healthy. Focus on fundamental factors. Increased internal divisions among Federal Reserve officials have cooled market expectations for a December rate cut, helping the US dollar index break through the 100 mark and reach a more than three-month high. This has significantly pressured cryptocurrencies, causing a market sell-off. Intraday consolidation is expected, awaiting a daily chart correction.
Daily Chart: The recent price action has been very robust. The daily chart is currently near key support. If it retraces to the lower Vegas Bollinger Band on the daily chart, the rebound could target the upper band, roughly around 109,000-110,000.
4-hour chart: Continuing its weak downward trend along the lower Bollinger Band, a rebound is needed after the recent pullback. Intraday short-term trading is recommended to consider a buy-on-dips strategy.
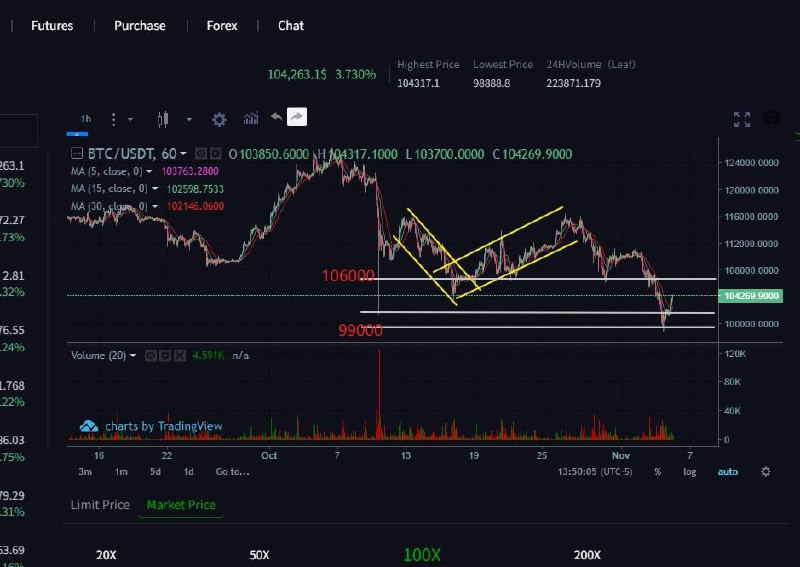
Upside resistance: 106000-107000
Downside support: 99000-98000