
Bitcoin Trend Analysis Today
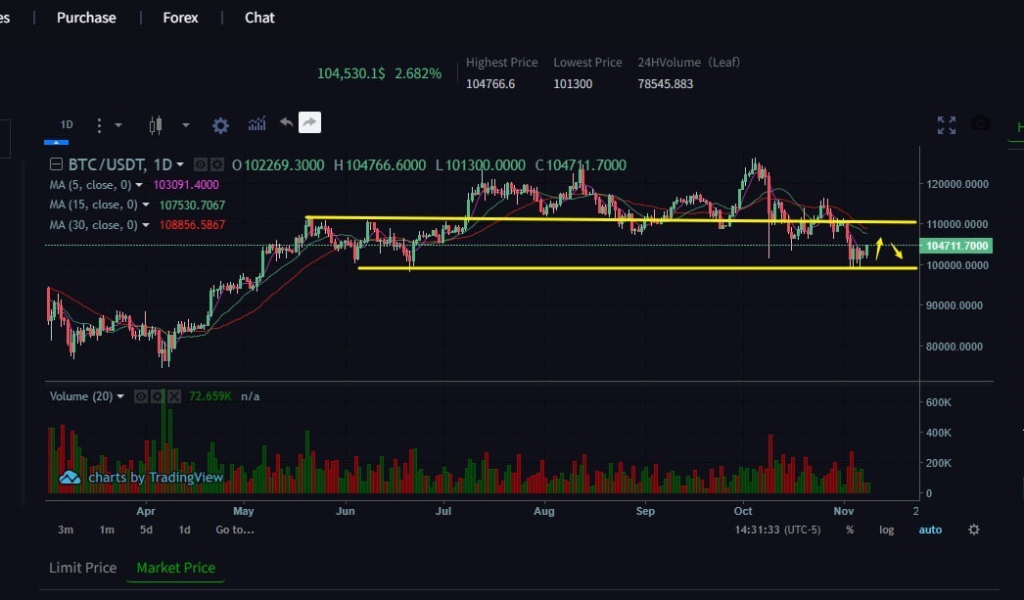
From a technical perspective, the daily chart for BTC shows a large bullish candlestick today, with the price quickly rising from a low of 101,400 to around 104,000, indicating a strong short-term rebound. On the hourly chart, recent candlesticks have been consistently bullish, with both highs and lows gradually rising, suggesting that bulls are in control in the short term. The hourly MACD indicator shows continued expansion of the bullish histogram, with both the DIF and DEA lines diverging upwards, indicating strong momentum. On the daily chart, the MACD golden cross has been followed by the emergence of bullish bars, clearly indicating a bullish trend. The daily RSI value is high but not excessively overbought, maintaining upward momentum