
Bitcoin Trend Analysis Today
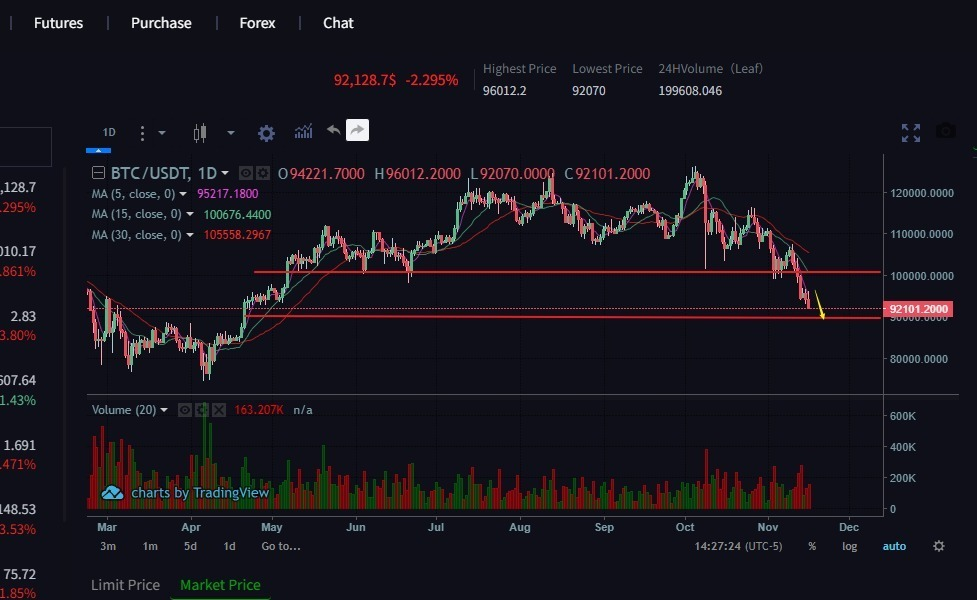
From the current market trend, the daily chart shows a continuous price decline, forming consecutive bearish candlesticks, indicating an overall weak pattern. The hourly chart shows a volatile downward trend, with the latest closing price lower than the previous hour’s low, suggesting further downside potential in the short term. The hourly MACD histogram is in negative territory and expanding, indicating increasing bearish momentum; the hourly EMA7, EMA30, and EMA120 are all in a bearish alignment, with the price consistently suppressed below the EMA7, indicating significant short-term pressure; the daily EMAs are also in a bearish alignment, suggesting a long-term bearish trend.