
Bitcoin Trend Analysis Today
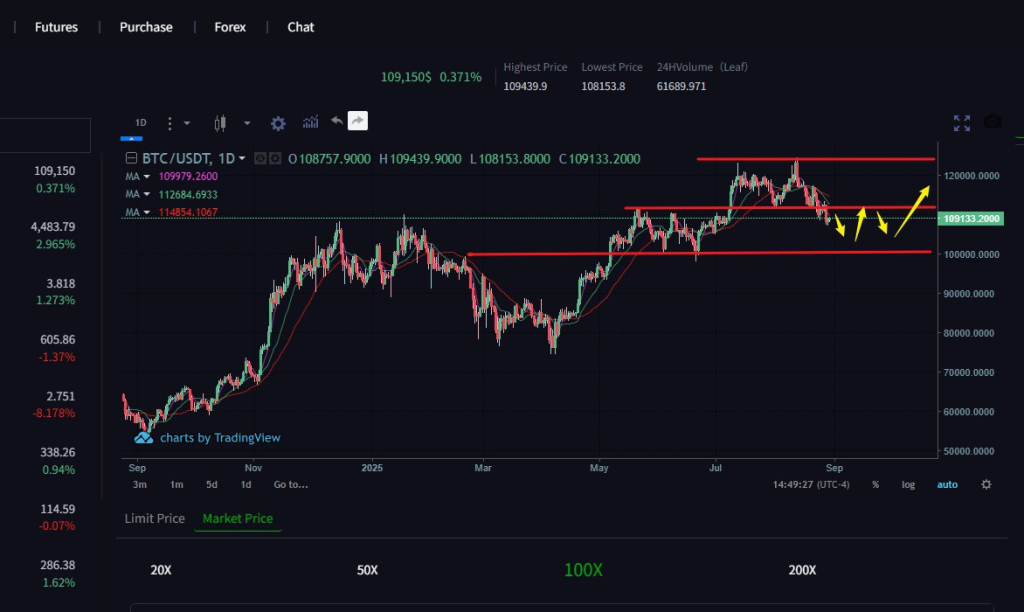

Intraday Support Level: 107000-107700
Intraday Resistance Level: 109000-109700
From a technical perspective, the market is clearly in its previous downtrend. Net capital outflows have occurred during the day, and the price has fallen below the key support level of 110,000 yuan. The 4-hour chart shows a series of bearish candlesticks, forming a stair-step decline. The MACD indicator shows that both the DIF and DEA on the hourly chart are below the zero axis, with a shortening green bar, but no golden cross has yet formed. This indicates that the current trend is bearish, but showing signs of weakening. Although there have been occasional technical rebounds over the weekend, overall trading volume is insufficient, and the market remains weak. Today, focus on the resistance level of 109000-109700 and short at high levels.

Day Trading Plan:
Short if the price reaches 109000-109700.
Long if the price falls below the support level.