
Bitcoin Trend Analysis Today
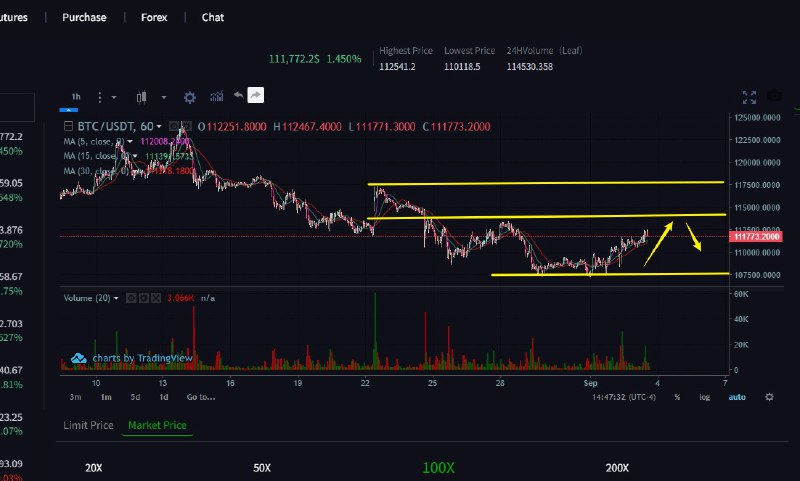
From a technical perspective, the daily BTC chart shows a recent sustained price increase, with multiple bullish candlestick patterns. Yesterday, the price broke through previous resistance near 112,000 and is currently demonstrating a strong upward trend. On the hourly chart, selling pressure is evident near 112,500. After a pullback from its high, prices have been consolidating, but the overall trend remains upward. The hourly MACD continues to show red bars and high volume, while both the DIF and DEA indicators are showing upward divergences, signaling a short-term bullish trend. The hourly RSI remains above 65, indicating a healthy trend. The daily EMA7 and EMA30 formed a golden cross and continue to expand upward, with the EMA120 well below the current price, indicating a long-term bullish trend.