
Today’s Bitcoin Trend Analysis
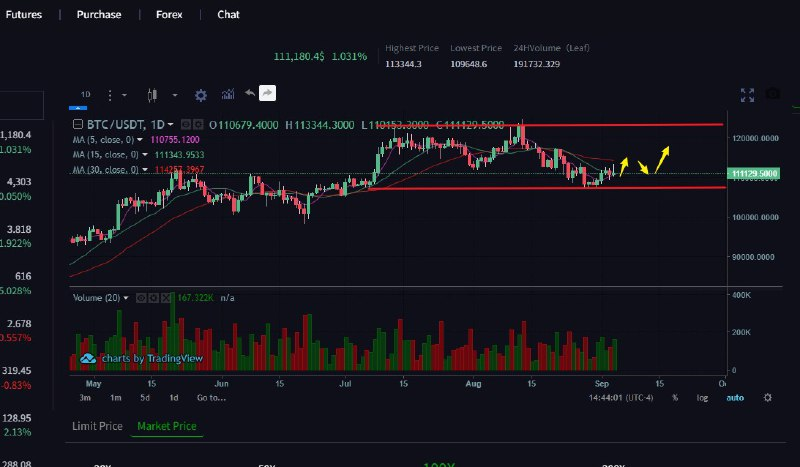
Looking at Bitcoin’s performance, the daily chart shows recent price fluctuations at a high level, with a long upper shadow forming yesterday, indicating strong selling pressure from above. The hourly chart has seen a rebound after several consecutive bearish candlestick patterns, but the strength of the rebound is limited, and the overall trend is weak. The hourly MACD technical indicator is forming a death cross, with a shortened red bar and weakening momentum. The daily MACD remains below zero, indicating a dominant bearish trend. The hourly RSI is near 43, not entering oversold territory but trending weakly. The daily RSI is below 50, indicating cautious market sentiment. The 7-day EMA and 30-day EMA on the hourly chart have crossed downward, while the 120-day EMA remains stable, suggesting a bearish short-term trend. Market volatility is expected this week, with a focus on buying low and selling high.