
Bitcoin Trend Analysis Today
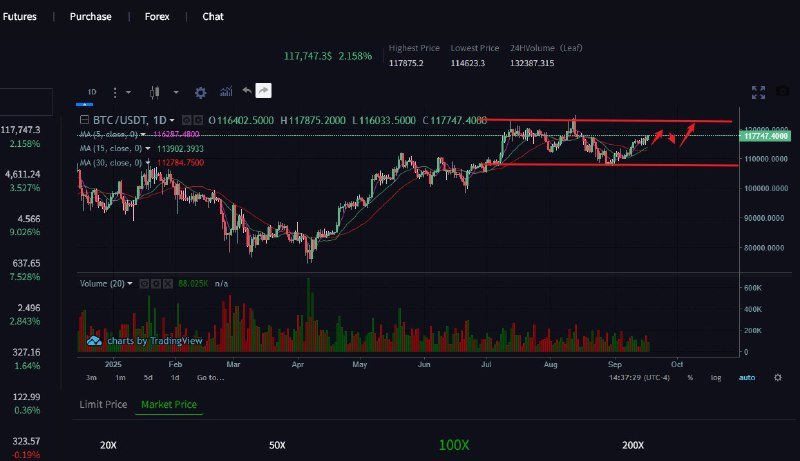
From a technical analysis perspective, BTC has been steadily rising on the daily chart, with yesterday’s strong bullish candle breaking through the previous high, indicating strong bullish momentum. On the hourly chart, the price has been trending upwards with a series of higher lows and higher highs, maintaining a bullish trend in the short term. Technical indicators show that the hourly MACD histogram is positive and increasing in volume, with the fast and slow lines diverging upwards, indicating strong momentum. Today’s short-term trading strategy: Buy at 116000; Sell at 118500.
The Fed’s 25 basis point interest rate cut was in line with market expectations. Cryptocurrency prices initially fell but then rebounded. While the market had already anticipated this rate cut, the Fed’s overall easing cycle is not over, and the underlying logic remains unchanged. Furthermore, the Fed’s rate cut was not the primary driver of the recent rise in cryptocurrency prices. The US dollar index and US Treasury yields initially declined but then quickly rebounded. Geopolitical risks, such as the escalation of the Russia-Ukraine conflict, tensions in the Middle East, and the impact of the energy crisis and war in Europe, also contributed to supporting cryptocurrency prices.