
Bitcoin Trend Analysis Today
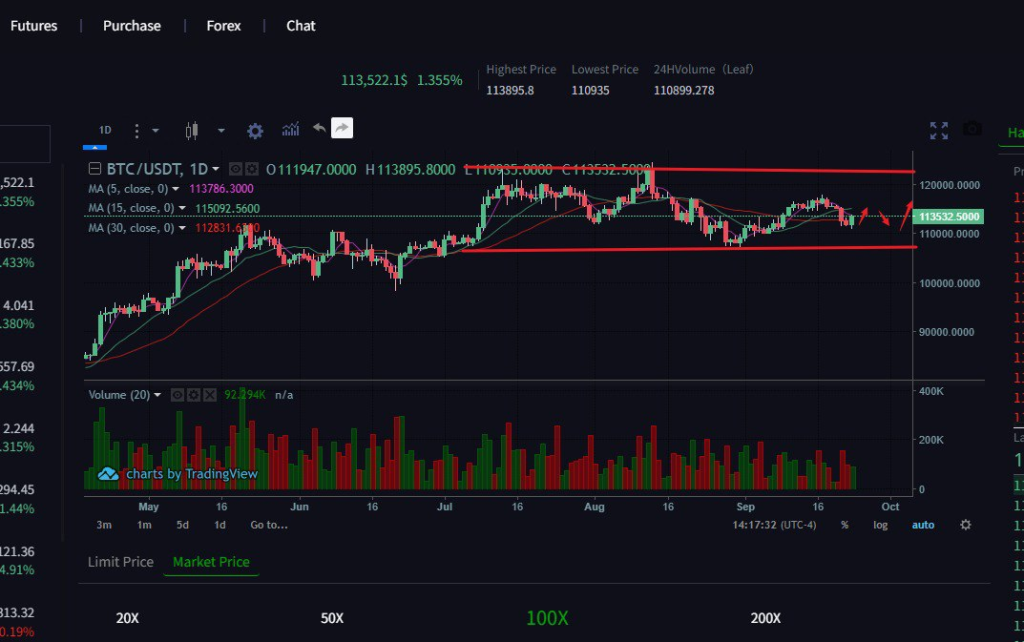
From a technical perspective, BTC recently formed a large bullish candlestick on the daily chart, signaling a strong bullish trend. On the hourly chart, BTC has seen a series of small, volatile bullish candlesticks at higher levels, suggesting some short-term upward pressure, but the overall trend remains positive. The hourly MACD indicator continues to show red bars and high trading volume, while both the DIF and DEA indicators are showing upward divergence, indicating strengthening market momentum. The daily RSI is at 66, indicating bullish market sentiment, strong short-term support, and a bullish long-term trend.
Today’s Bitcoin Short-Term Trading Strategy
Long around 113,000
Short around 115,400