
Bitcoin Trend Analysis Today
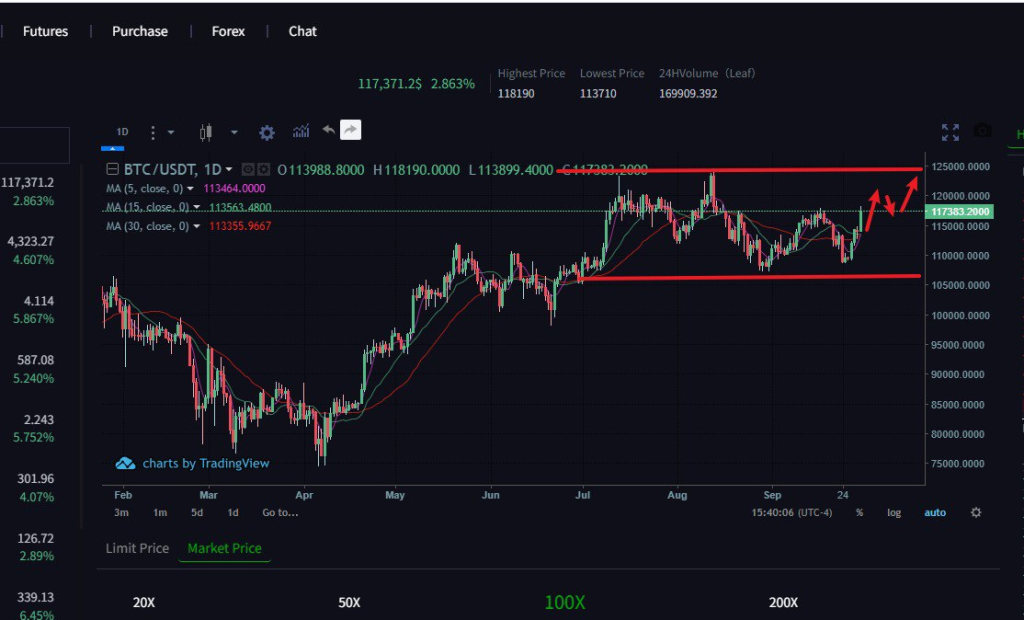
From a technical perspective, Bitcoin’s daily chart shows a recent continuous price increase, with a large bullish candlestick formed yesterday, breaking through the previous range. The hourly chart shows a step-by-step upward trend, but there are signs of a slight pullback from the current high. The hourly DIF and DEA indicators in the MACD technical indicators are both above the zero axis, with the histogram shortening and momentum weakening. A bullish trend is evident on the daily chart, with continued volume growth. The hourly chart is in overbought territory near 75, suggesting potential for a short-term correction. The daily RSI is gradually entering strong territory, indicating an overall bullish trend. The hourly EMA7, EMA30, and EMA120 are all bullish, with the price consistently trading above the EMA7. The daily EMA system also maintains a bullish pattern, providing strong support. In the short term, a trend-following long position is the primary strategy.