
Today’s Bitcoin price analysis
Bitcoin trading strategy today
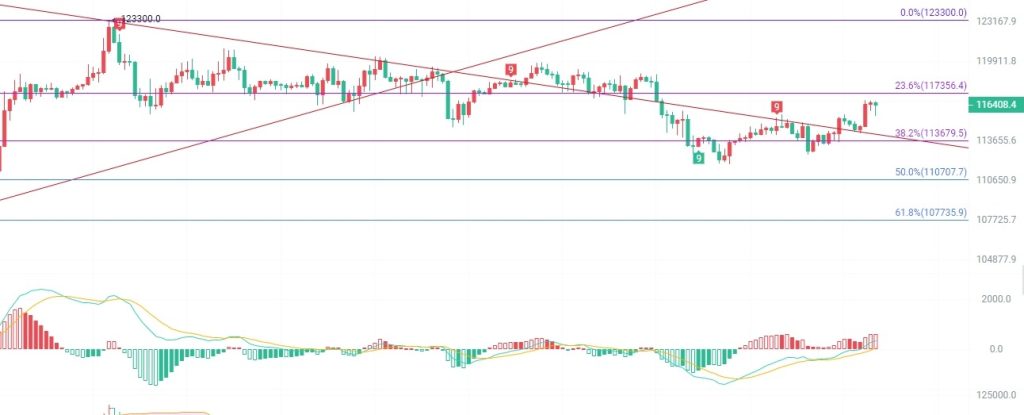
BTC’s four-hour candlestick chart currently shows key resistance at 117,350, the golden ratio line of 0.236. It has now retraced to the support level of the upward trend at 115,600 and has now rebounded above 116,000. The MACD continues to increase in volume, and the DIF and DEA lines have broken through the 0 axis and entered the upward zone. The candlestick chart has returned to the Bollinger Band channel, with the upper band forming resistance at 116,600 again. The middle band support level is 114,700.
Short-term trading strategy reference:
Go long at the low of 114,000 and short at the high of 117,000.