
Today’s Bitcoin Trend Analysis
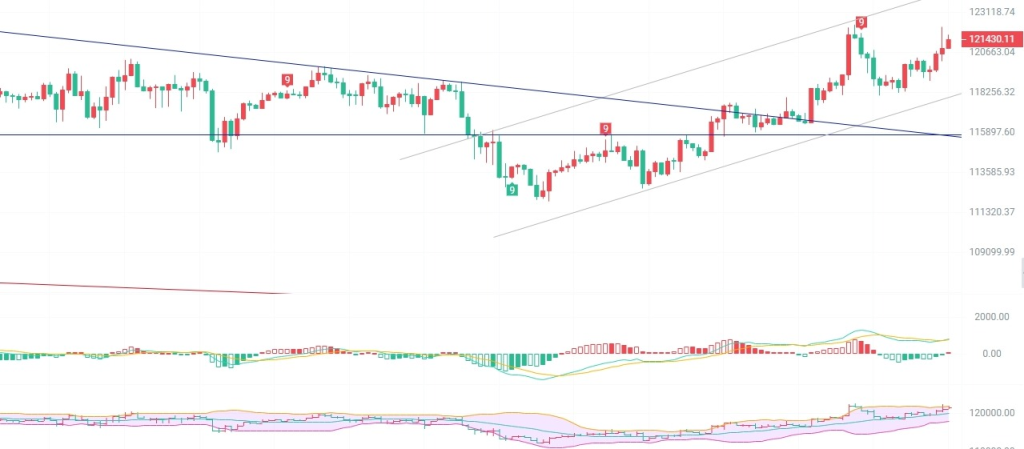
Bitcoin is currently trading at 121,850. Based on the current trend, all indicators have reached overhead resistance, suggesting a potential all-time high. EMA trend indicators are all bullish, the MACD has formed a golden cross, and trading volume continues to increase. Furthermore, the daily chart has broken through the upper Bollinger Band resistance level of 121,630. All indicators have reached resistance levels, suggesting a rise in Bitcoin prices. The four-hour chart has reached a high, and the market remains in an uptrend. The MACD has stopped shrinking, and trading volume continues to increase. The DIF and DEA have formed a golden cross, breaking through 121,600. Focus on the upper Bollinger Band resistance level of 121,850. We recommend entering a trade after a breakout of resistance and confirmation of shrinking volume.
Short-Term Trading Strategy
Go long between 118,500 and 119,000
Go short between 122,000 and 122,500