
Bitcoin Trend Analysis Today
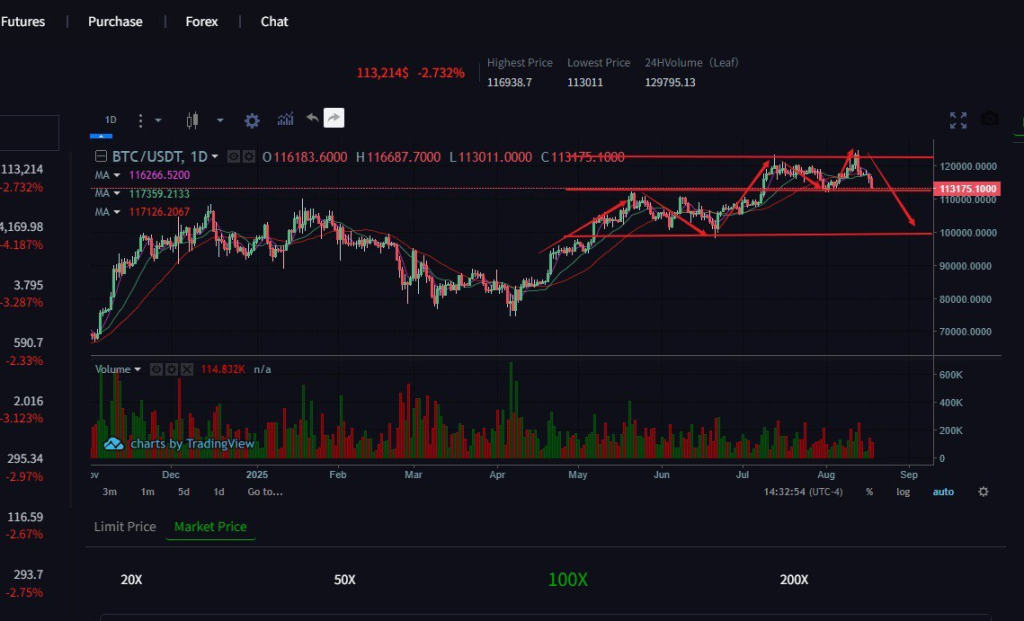
Bitcoin is currently trading at $113,200, having reached a daily high of $116,725. Since its all-time high, Bitcoin has fallen over 10,000 points. Furthermore, the daily chart has broken through the 0.786 resistance level at 113,800, marking the next support level. The next support levels are the 90-day moving average support at 111,300 and the lower Bollinger Band support at 111,500. The four-hour chart shows a more pronounced bearish trend, signaling a short-term downtrend. The four-hour trend indicator has formed a three-line death cross, alternating downward. The chart has reached the lower Bollinger Band at 113,400. Today’s trading strategy is to short at resistance levels, while caution is advised when buying at support levels.
Today’s Bitcoin Short-Term Trading Guide:
Short at highs between 114,000 and 114,500
Long at lows between 111,500