
Today’s Bitcoin Trend Analysis
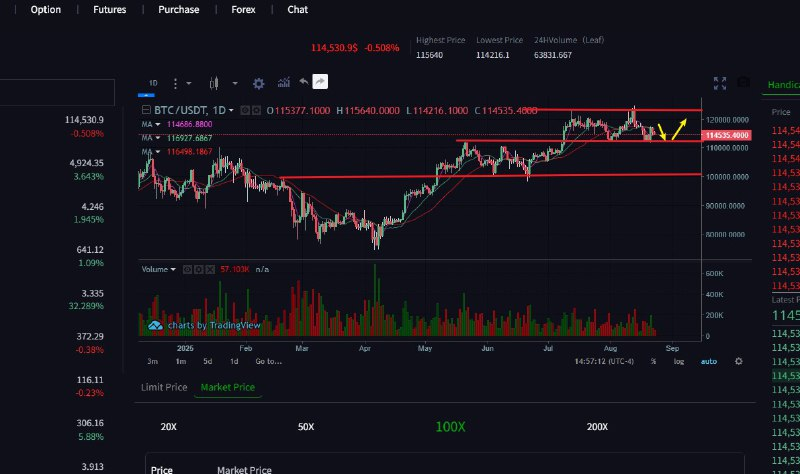
BTC’s daily chart has fallen for two consecutive days, forming a temporary downward correction. The hourly chart has seen minimal recent volatility, but the overall trend remains weak and volatile, gradually recovering from its lows, but the rebound has been weak. The hourly DIF and DEA indicators are both trading below zero and expanding into negative territory, indicating a dominant bearish trend. The daily MACD has shown a large green candlestick pattern, further confirming downward pressure. The hourly EMA7, EMA30, and EMA120 are all showing a bearish trend. The price has come under pressure and repeatedly touched the EMA7 before retreating, signaling strong short-term resistance. The daily EMA is also showing a bearish trend, indicating that support has yet to be established. For intraday trading, monitor the strength of support near 112,500, adopting a strategy of short-term trades at highs and long positions at lows.