
Today’s Bitcoin Trend Analysis
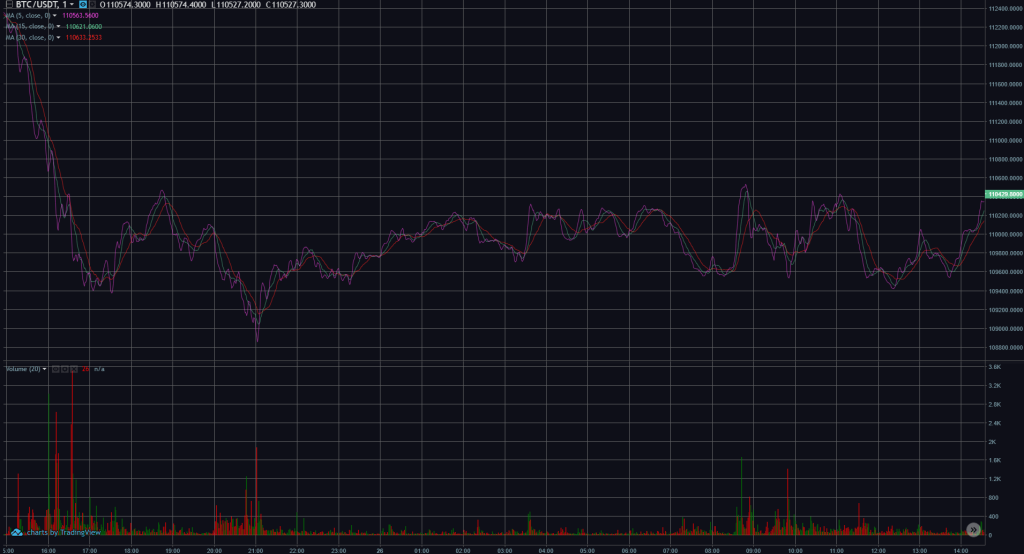
Bitcoin is currently trading at 110,500. Yesterday, I mentioned the continuation of the bearish trend of the “Three Crows” pattern. Consecutive pullbacks have resulted in shorts hitting almost all of the resistance levels above. The EMA120 trendline support at 109,200 has now been broken, and the main force is trading sideways above that support level. Next, focus on resistance at 113,800 and support at the 0.618 dividing line at 105,500. The four-hour candlestick chart supports at 107,800. The MACD is showing a bottoming divergence with shrinking upward volume. The Bollinger Bands are declining, with the lower support band at 108,000. The middle band is focused on 112,400. Short-term resistance levels are at 110,000, and the mid-term resistance level is at 112,500.
Short-term trading strategy
Buy at 118,500
Short-term short at 112,500