
Today’s Bitcoin Trend Analysis
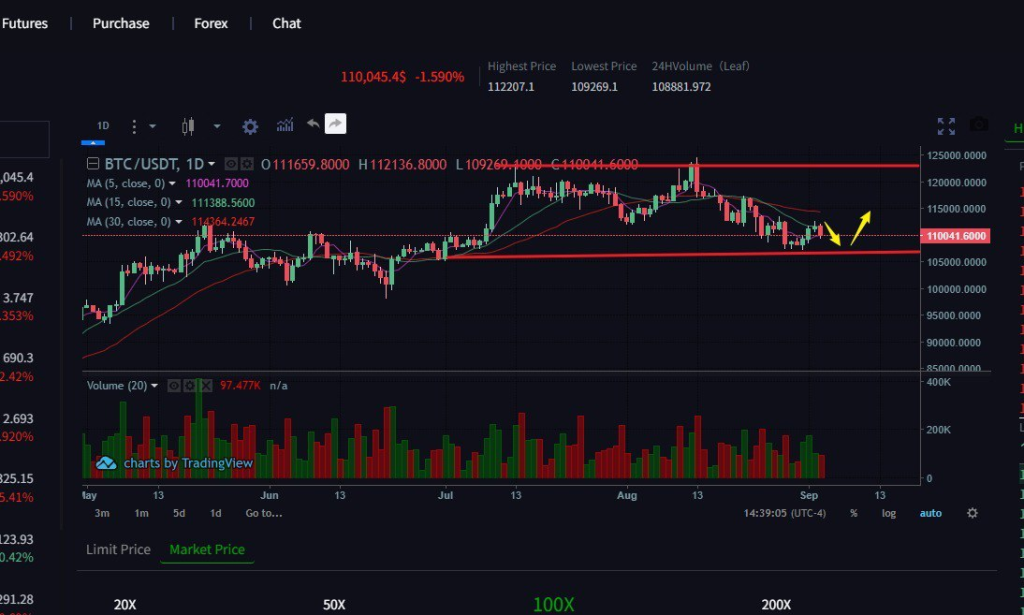
From a technical perspective, BTC is currently in a weak correction. The daily chart shows a recent rapid price decline, forming a large bearish candlestick pattern, indicating a clear correction. The hourly chart shows a series of bearish candlestick patterns after high volatility, with continued declines in short-term lows, signaling a bearish market trend. The MACD hourly chart’s DIF and DEA indicators are both negative and diverging downward, with large green bars and heavy trading volume, signaling market weakness. A death cross has also formed on the daily chart, indicating strong bearish momentum. The daily RSI is gradually declining, suggesting further downside potential. The hourly EMA7, EMA30, and EMA120 are all showing bearish trends, with the price trading below all of them, indicating significant short-term pressure. The daily EMA7 has turned downward, suppressing prices and maintaining an overall bearish trend.