
Today’s Bitcoin Trend Analysis
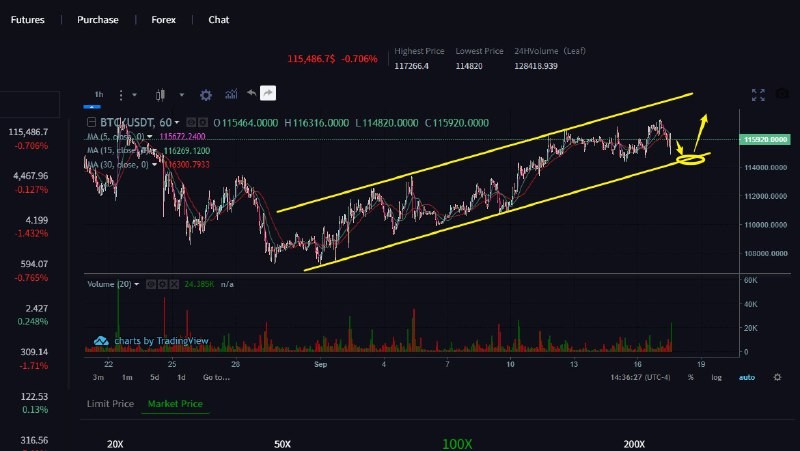
Bitcoin is currently in a clear downtrend, and technical signals indicate bearish momentum. The moving average system shows a bearish arrangement, with both short-term and long-term moving averages trending downward. The price is trading below these moving averages, indicating a bearish trend. The daily chart fluctuates between 115,000-117,000, with strong support below. The 2-hour candlestick chart shows a downward trend from the high point, and the latest candlestick forms a small positive candlestick pattern, reflecting the fierce short-term battle between bulls and bears. The 2-hour EMA is under short-term pressure, while the daily EMA 120 provides long-term support. In the short term, after testing this bottom, it is recommended to go long around $114,000 and short around $117,000.