
Today’s Bitcoin Trend Analysis
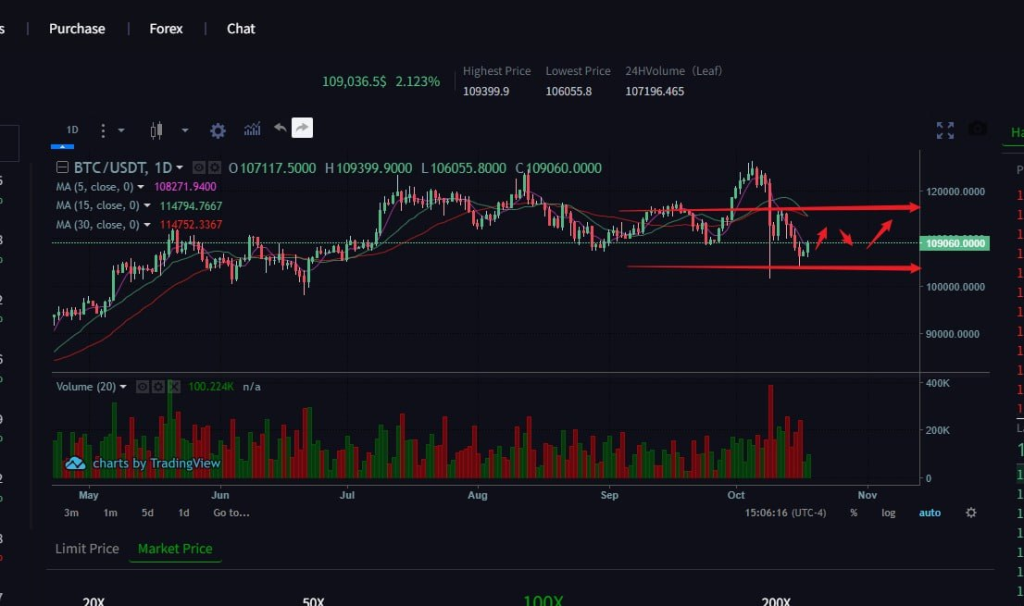
From a technical perspective, Bitcoin currently has two positive lines on the daily chart, showing a strong upward trend in the short term. The recent highs of the hourly chart have gradually risen, and the lows are also constantly moving up, maintaining a strong and volatile trend in the short term. The technical indicator MACD hourly line is in a red column state, and both DIF and DEA are diverging upward, indicating that the current trend is still bullish, but attention should be paid to whether there will be a top divergence signal in the future. The RSI hourly line value is 70.7, entering the overbought range, and there may be a risk of a callback, but the daily RSI has not reached the overbought area, and the overall trend is upward. In the EMA hourly line, EMA7>EMA30>EMA120, the moving averages are in a bullish arrangement, and the short-term support levels are at 107500 and 104500 respectively. The resistance level above 112000