
Bitcoin trend analysis
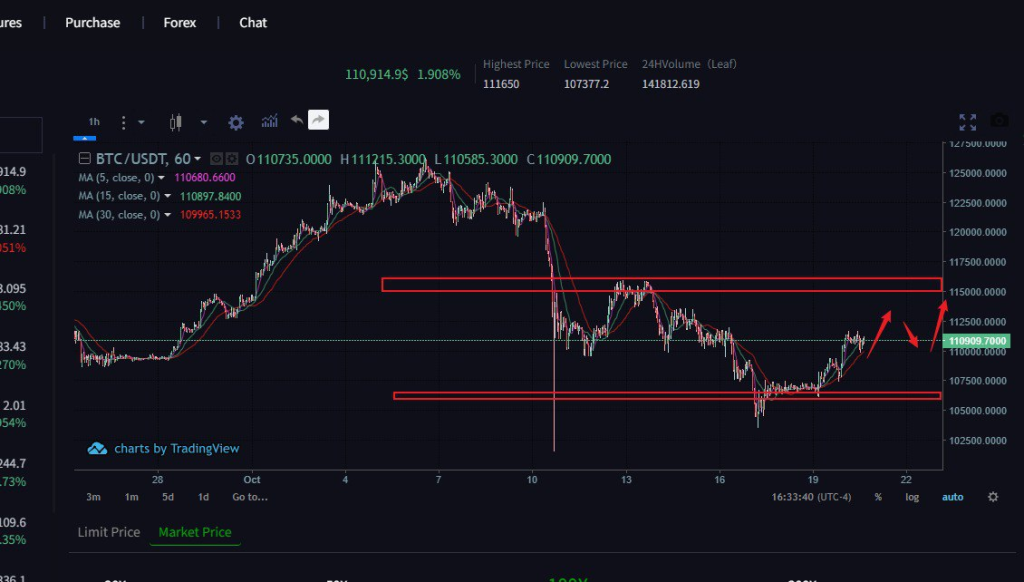
From a technical perspective, BTC is currently forming consecutive bullish candlestick patterns on the daily chart, indicating an upward trend. The hourly chart has recently fluctuated at a high level, experiencing a slight pullback, but overall remains within an upward trend. The MACD hourly DIF and DEA indicators are gradually converging. The MACD histogram has shortened again after turning positive, indicating weakening momentum and warrants attention for further corrections. The hourly RSI reading is 58.27, breaking out of overbought territory, suggesting a possible period of short-term volatility or a correction. The hourly EMAs (EMA7>EMA30>EMA120) show a bullish alignment, providing strong support. While there may be a short-term pullback, the strength is limited. As long as the support level of 107,500 holds, a short-term rebound is unlikely