Bitcoin Trend Analysis Today

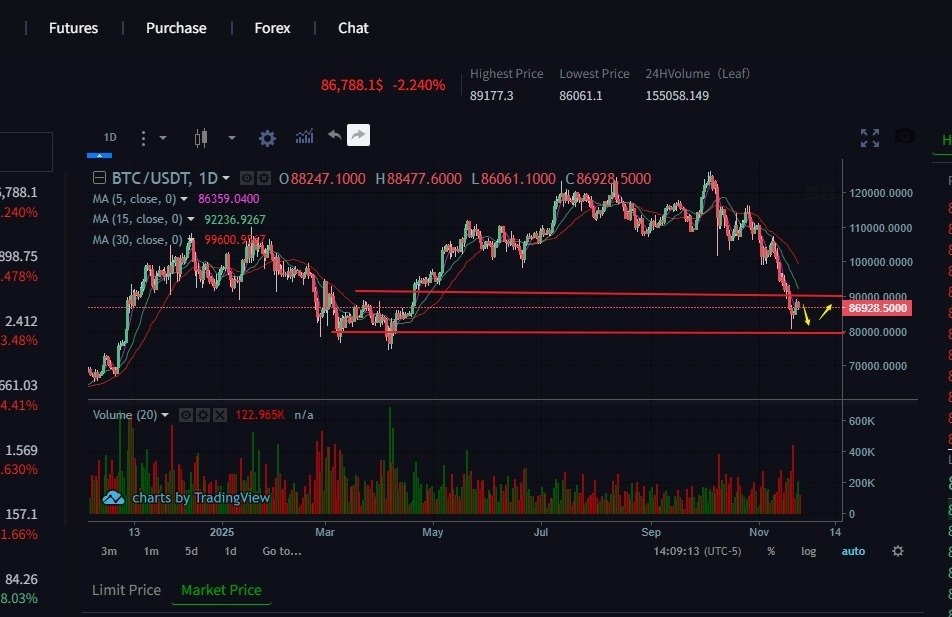
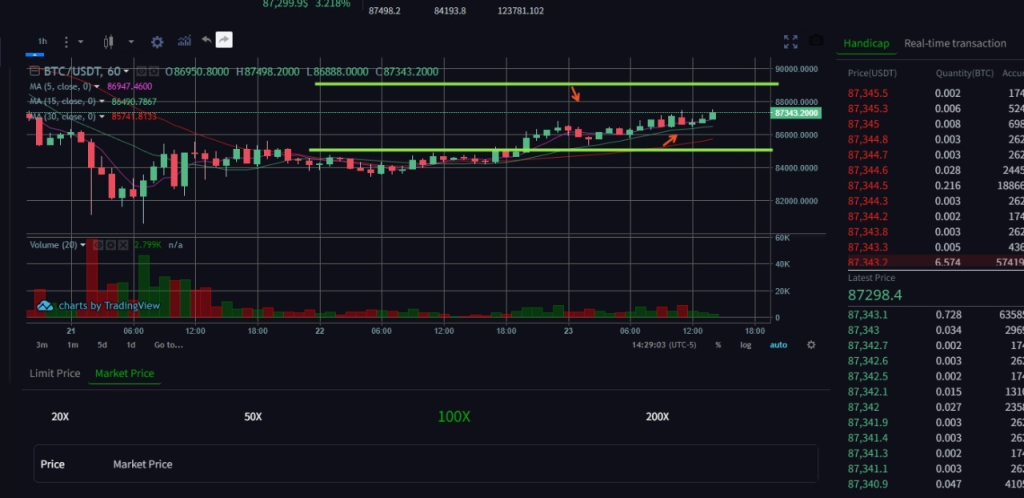
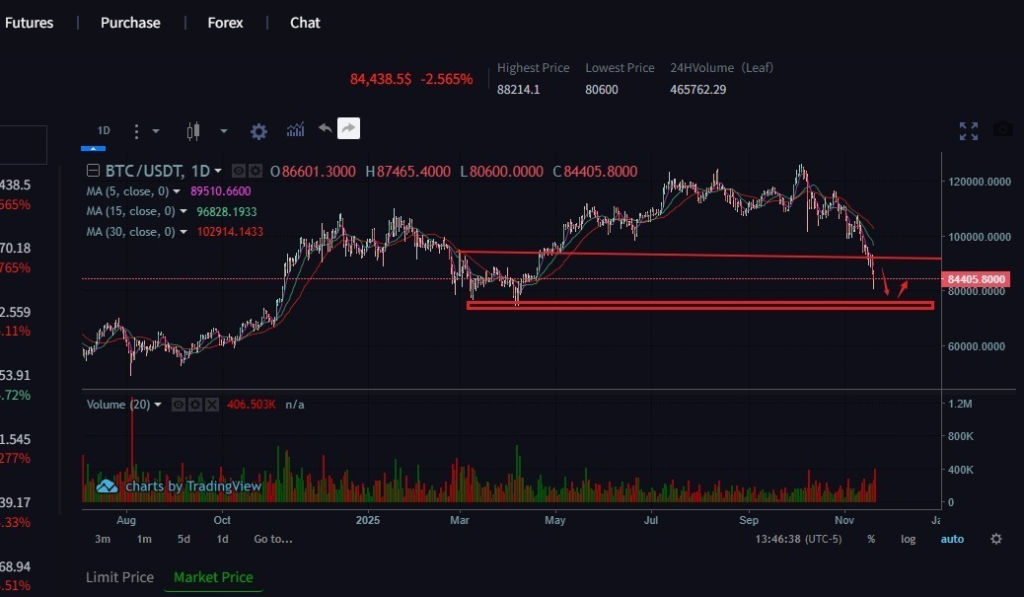
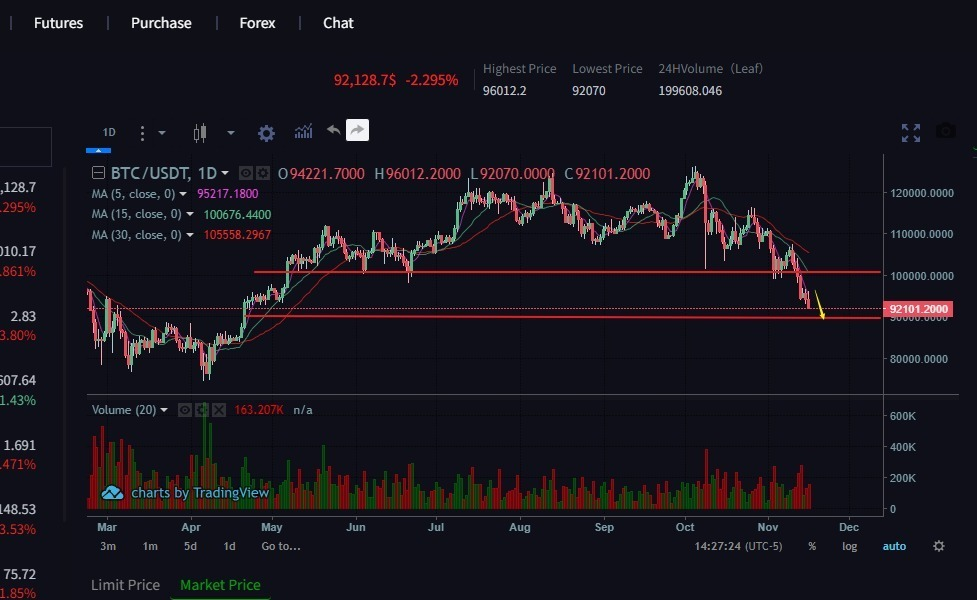
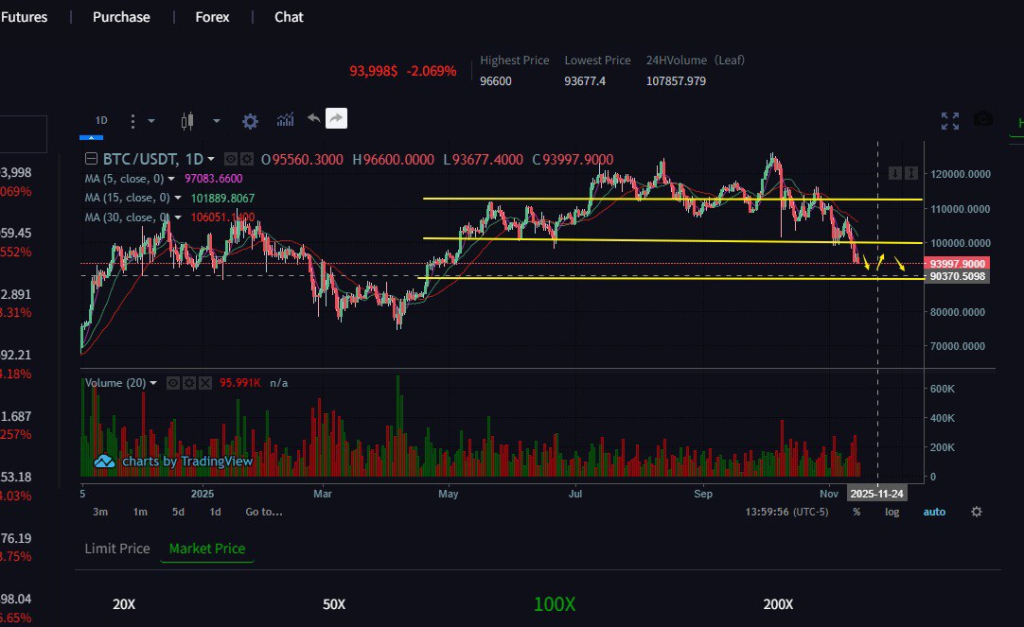
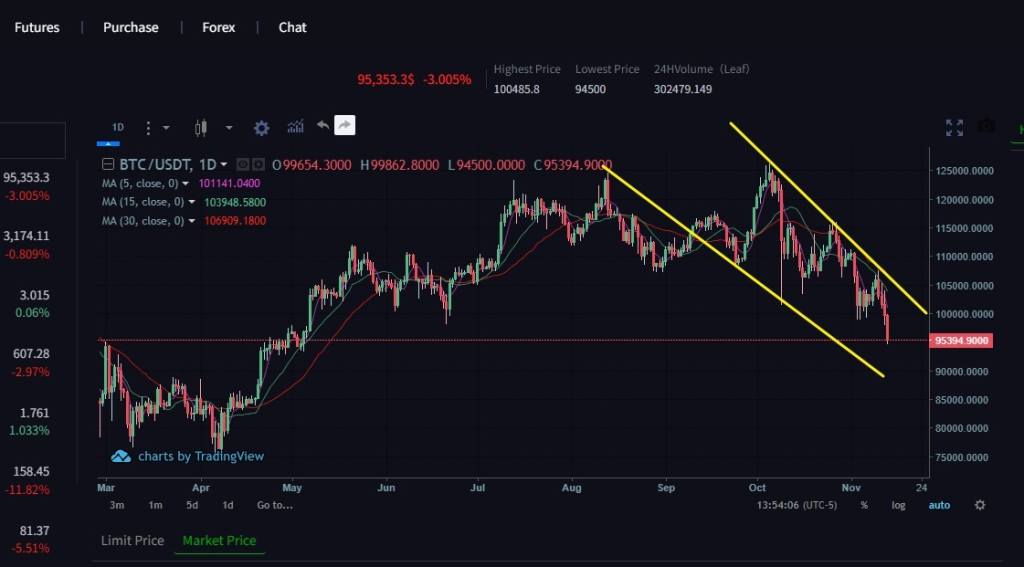
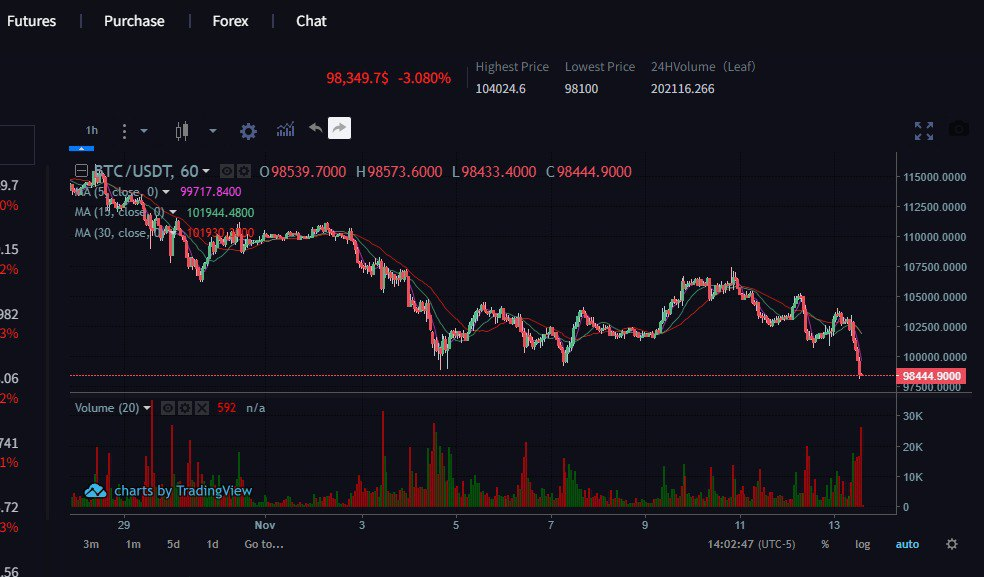
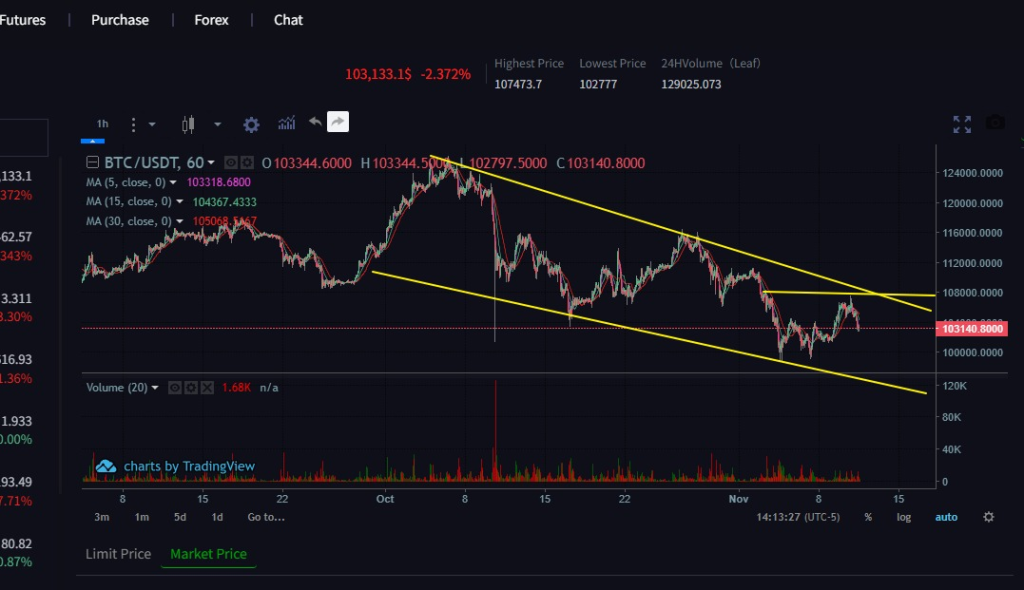
Bitcoin is currently priced at $86,900. The BTC market is currently in a state of uncertainty due to both technical factors and the external environment. Key support is around $80,600, and resistance is around $88,885. Moving averages are in a bearish alignment, but short-term momentum is weakening, and the moving averages are flattening, suggesting the market may be entering a period of observation. On the daily chart, bulls and bears are battling, with the price fluctuating and falling back near the highs. The MACD indicator on the 2-hour chart shows that bears dominate in the short term; however, the uptrend on the daily chart has not been completely broken. Currently, the market may fluctuate within a range, and the recommended strategy is to short at higher levels and long at lower levels

Bitcoin Trend Analysis

Bitcoin is currently priced at 88,700, exhibiting low-volatility range-bound trading. While trend indicators still show a bearish alignment, short-term candlestick patterns have formed a bullish engulfing pattern, creating potential bullish resonance. The price level near the Bollinger Band’s middle line further indicates a relatively balanced market sentiment, making a clear breakout unlikely in the short term. Strong buying support exists at the daily chart’s lows. The 2-hour candlestick shows a small bullish candle, indicating short-term bullish dominance. The 2-hour MACD bullish signal is strengthening; the daily chart remains in a weak recovery phase, with the EMA providing effective short-term support, and the overall trend leaning towards bullish. Currently, the market is at two extremes: a short-term overall bullish trend and a long-term overall bearish trend. The recommended strategy is to primarily short on rallies, following the larger trend.

Bitcoin Trend Analysis

After a period of decline, Bitcoin’s price has continued to consolidate and recover. The intraday pullback resulted in a rebound, and the current price is above 86,000. This high level has reached short-term resistance, and the next resistance level to watch is the intraday high. If the rebound fails to break and stabilize above this area, there is a risk of further pullback to support. Conversely, if it breaks upwards, the price may move further towards the 90,000 level. Looking at the short-term hourly chart, the price is currently under pressure and undergoing a pullback. The short-term rebound is relatively weak, and the price is expected to test lower levels further. The key support level to watch is 85,000. If this level holds, the price will continue to consolidate within the range; otherwise, it will test lower levels again. Our current strategy remains to buy low and sell high. The upper resistance level to watch is 89,000, and the lower support level is around 85,000. If this level holds, the downtrend is unlikely to begin in the short term. Consider entering long positions on pullbacks, with stop-loss orders in place if the price breaks through. If the price breaks below this level, follow the trend with short positions to capture short-term profits

Short at 87500-88500, stop loss at 90500, target below 865000. Long at 85300-84300, stop loss at 500, stop loss at 80000, target above 86300

Bitcoin Trend Analysis Today

From a technical perspective, BTC has broken through several key support levels recently. Short-term moving averages are in a bearish alignment, with the 50-day moving average crossing below the 200-day moving average, forming a typical death cross. The trading volume has increased significantly during the decline, indicating concentrated and active selling pressure. The RSI has entered oversold territory but has not yet shown a bottom divergence, and the MACD is also showing increasing volume below the zero line, indicating a continued bearish trend. In the short term, BTC may consolidate at low levels with limited rebound potential. Unless there is a significant increase in volume and stabilization, stronger on-chain buying, and a recovery of key support levels, it is not advisable to be bullish easily.

On a larger timeframe, the expected support is around $78,000–$76,000. A further break below this level could test the $70,000 area. Resistance is around $90,000–$95,000.

Bitcoin Trend Analysis Today

From the current market trend, the daily chart shows a continuous price decline, forming consecutive bearish candlesticks, indicating an overall weak pattern. The hourly chart shows a volatile downward trend, with the latest closing price lower than the previous hour’s low, suggesting further downside potential in the short term. The hourly MACD histogram is in negative territory and expanding, indicating increasing bearish momentum; the hourly EMA7, EMA30, and EMA120 are all in a bearish alignment, with the price consistently suppressed below the EMA7, indicating significant short-term pressure; the daily EMAs are also in a bearish alignment, suggesting a long-term bearish trend.

Bitcoin Trend Analysis Today

From a technical perspective, the current daily chart shows a continuous price decline, forming a series of bearish candlesticks, indicating an overall weak trend. On the hourly chart, the price has been consolidating after a pullback from its highs, with the current candlestick pattern within a relatively narrow trading range and no clear reversal signal. The hourly MACD indicator shows both the DIF and DEA lines are negative and trending downwards, with the MACD histogram showing expanding green bars, indicating that bearish forces are dominant. The hourly EMA (7, 30, and 120 moving averages) are in a bearish alignment, with the price trading below the EMA7, suggesting a downward trend. The daily EMA also shows a bearish alignment, further confirming the overall weakness. Therefore, the recommended strategy remains to sell on rallies.

Bitcoin Trend Analysis Today

Daily Chart: The price has fallen for three consecutive days, with all Bollinger Bands trending downwards. The KDJ indicator has formed a death cross and continues to diverge downwards. The MACD indicator has confirmed a second death cross, indicating a strong downtrend. As mentioned yesterday, a further pullback to lower levels was expected, and last night’s price action confirmed this prediction.

4-Hour Chart: The market has also fallen for three consecutive days, with concentrated downward momentum. The Bollinger Bands are widening, and the current downtrend remains firm. Notably, the price did not break below the lower band after touching it, instead showing signs of stabilization. Intraday short-term trading is recommended, buying on dips

Bitcoin Trend Analysis Today

Bitcoin is currently priced around $98,400, having broken below the $100,000 mark. The MACD histogram shows a renewed increase in red bars, and the DIF and DEA lines failed to converge intraday, forming a downward divergence again. This marks the second unsuccessful convergence after a death cross, indicating relatively strong bearish momentum. The KDJ lines are converging and diverging downwards, approaching oversold territory. The RSI lines are above 30 and continuing downwards. I believe the downside potential is not yet exhausted, and the strategy remains to sell on rallies.

The Bitcoin crash has caused significant losses for those investing in spot trading, but it has no impact on our futures trading. This is because we can short Bitcoin when the market is bearish, which is one of the advantages of futures trading. So far, all the Bitcoin signals I’ve shared have been correct.

Bitcoin Trend Analysis Today

The daily chart for BTC shows a recent continuous price decline, forming a long bearish candlestick. It touched a low of 101,300 on November 12th, indicating overall weakness. The hourly chart saw a rapid drop on the morning of November 12th, with the candlestick body shrinking, suggesting a potential short-term bottom. The hourly MACD indicator is below the zero line, with both DIF and DEA values ​​negative. The MACD histogram has gradually narrowed after several periods of increasing volume, indicating weakening bearish momentum. The hourly EMAs (7, 30, and 120 moving averages) are in a bearish alignment. The EMA7 is close to the current price, indicating significant short-term resistance; the EMA30 and EMA120 are far from the price, suggesting continued medium-term weakness. In the short term, watch the strength of the support level around 100,000.

Bitcoin Trend Analysis Today

After rebounding from the 1-hour downtrend channel, BTC is currently trading near the middle band. The first pullback could present entry points in the 103000-102500 range, or a direct rebound from 103000. The major volatility will focus on the CPI data on Thursday the 13th. It’s unlikely to reach resistance quickly; continue to monitor the upper channel line above 108000, where short positions can be initiated in stages. Last night’s failure to break through the resistance level resulted in a decline in the lows.

Welcome to join our WhatsApp communication group

Join our group for daily expert guidance on stocks and crypto, market insights, and proven strategies Elevate your skills and pursue financial freedom