Fed’s Collins: Monetary policy currently in right place, hesitant about cutting rates
  • Fed’s Collins remains hesitant to cut interest rates again
  • Collins says Fed facing conflicting movement in mandates
  • Collins says will go into FOMC with open mind

Federal Reserve Bank of Boston President Susan Collins said Saturday that she’s still leaning against the U.S. central bank cutting its interest rate target next month as it faces ongoing risks to both its inflation and job mandates.

Read More
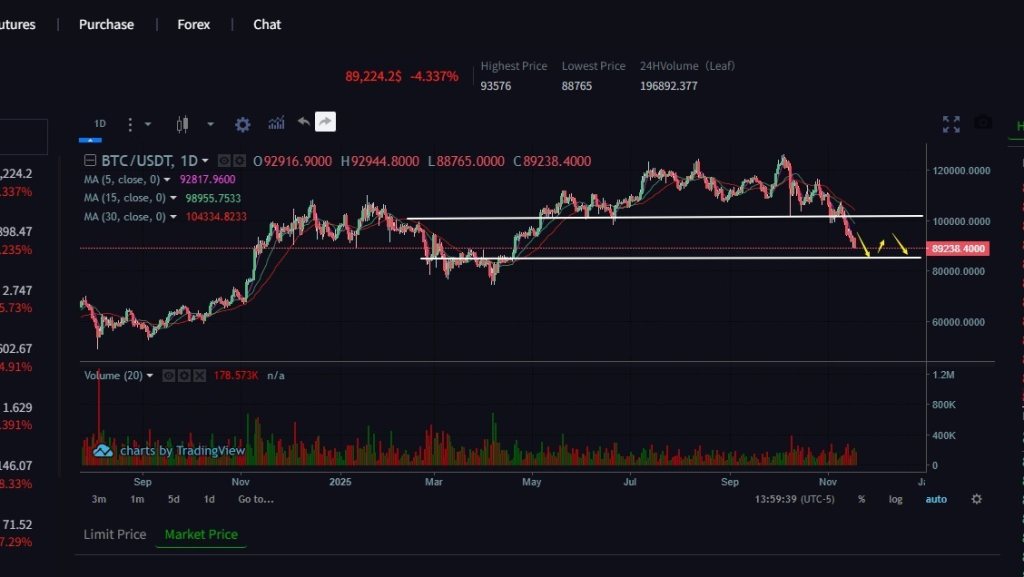
Bitcoin Trend Analysis Today

Daily chart: The decline is smooth; although there have been rebounds, they are weak. Indicators are all in a death cross and show no signs of turning back, indicating further downside potential.

4-hour chart: After a series of rebounds, three consecutive bearish candles have appeared, indicating significantly insufficient bullish momentum. The key resistance level above has not been effectively broken. The RSI has turned from flat to a death cross, and the overall pattern remains bearish. Intraday short-term trading is recommended to focus on selling on rallies.

Upside resistance: 93000-94000
Downside support: 87500-86500

Bitcoin Trend Analysis Today

Bitcoin is currently in a short-term rebound phase, with the MACD golden cross and Bollinger Band middle line providing positive support, but the KDJ overbought condition poses a risk of volatility. In the medium term, a breakout above the 107708-109759 range could confirm a reversal, targeting 112000-114000. Initial support is at 103000, with strong support at 99000; resistance lies in the 108000-110000 range. Overall, Bitcoin has entered a rebound phase after the sharp drop, with bullish momentum recovering, but the medium-term trend has not completely reversed. Short-term trading is recommended to buy low and sell high while controlling position size, waiting for a breakout with significant volume to confirm the trend.

Bitcoin Trend Analysis

The latest BTC price is approximately $110,000-$115,000. According to data, the recent decline is around 3%. Technical indicators: the RSI is around 45, indicating a neutral to slightly bearish state; trend indicators (such as ADX) are at a moderate strength level. On-chain and cost basis analysis shows that the price is approaching the average cost range of buyers from the last 1-3 months, creating potential resistance. Key support and resistance levels: Resistance is around $113,000-$115,000; support is around $106,000-$110,000. Upside scenario: If BTC can break through the $113,000-$115,000 resistance with increased volume, it may surge towards $120,000 or higher in the short term. Downside scenario: If it fails to break through the resistance and falls below the $106,000-$110,000 support, a pullback or even a deeper correction is possible. On-chain data shows that selling pressure may increase when prices are trading below cost. Consolidation is likely: Given the neutral indicators, the market may remain in a consolidation phase, fluctuating between the aforementioned support and resistance levels, awaiting new catalysts (such as macroeconomic policies, ETF liquidity, and regulatory news).

Welcome to join our WhatsApp communication group

Join our group for daily expert guidance on stocks and crypto, market insights, and proven strategies Elevate your skills and pursue financial freedom